
Bearish signal on daily chart
In the last 17 years, only 2.15 % trading sessions saw intraday declines higher than 5 % .
In the last 17 years, only 2.15 % trading sessions saw intraday declines higher than 5 % .
Company has sufficient cash reserves to pay off its contingent liabilities. (Source: Standalone Financials)
Company has spent less than 1% of its operating revenues towards interest expenses and 5.64% towards employee cost in the year ending Mar 31, 2024. (Source: Standalone Financials)
20 day moving crossover appeared on Sep 17, 2024. Average price decline of -3.45% within 7 days of this signal in last 5 years.
Timken India Ltd. share price moved down by -0.01% from its previous close of Rs 3,759.10. Timken India Ltd. stock last traded price is 3,759.05
| Share Price | Value |
|---|---|
| Today/Current/Last | 3,759.05 |
| Previous Day | 3,759.10 |
PE Ratio (x) | 70.99 | ||||||||||
EPS - TTM (₹) | 52.95 | ||||||||||
MCap (₹ Cr.) | 28,275.47 | ||||||||||
Sectoral MCap Rank | 8 | ||||||||||
PB Ratio (x) | 11.70 | ||||||||||
Div Yield (%) | 0.07 | ||||||||||
Face Value (₹) | 10.00 | ||||||||||
Beta Beta
| 1.70 | ||||||||||
VWAP (₹) | 3,758.65 | ||||||||||
52W H/L (₹) |
| 1 Day | -0.01% |
| 1 Week | 0.89% |
| 1 Month | 2.63% |
| 3 Months | -20.23% |
| 1 Year | 19.42% |
| 3 Years | 123.38% |
| 5 Years | 405.96% |

Current
Mean Recos by 7 Analysts
| Ratings | Current | 1 Week Ago | 1 Month Ago | 3 Months Ago |
|---|---|---|---|---|
| Strong Buy | 1 | 1 | 1 | 1 |
| Buy | 4 | 4 | 4 | 4 |
| Hold | 2 | 2 | 2 | 1 |
| Sell | - | - | - | - |
| Strong Sell | - | - | - | 1 |
| # Analysts | 7 | 7 | 7 | 7 |
Employee & Interest Expense
Company has spent less than 1% of its operating revenues towards interest expenses and 5.64% towards employee cost in the year ending Mar 31, 2024. (Source: Standalone Financials)| Quarterly | Annual | Jun 2024 | Mar 2024 | Dec 2023 | Sep 2023 | Jun 2023 |
|---|---|---|---|---|---|
| Total Income | 795.60 | 908.52 | 622.79 | 692.07 | 726.93 |
| Total Income Growth (%) | -12.43 | 45.88 | -10.01 | -4.80 | -10.17 |
| Total Expenses | 664.68 | 720.86 | 530.71 | 567.54 | 603.19 |
| Total Expenses Growth (%) | -7.79 | 35.83 | -6.49 | -5.91 | -10.10 |
| EBIT | 130.92 | 187.66 | 92.08 | 124.53 | 123.74 |
| EBIT Growth (%) | -30.23 | 103.81 | -26.06 | 0.63 | -10.51 |
| Profit after Tax (PAT) | 96.31 | 141.43 | 67.53 | 93.05 | 90.14 |
| PAT Growth (%) | -31.91 | 109.44 | -27.42 | 3.23 | -13.76 |
| EBIT Margin (%) | 16.46 | 20.66 | 14.78 | 17.99 | 17.02 |
| Net Profit Margin (%) | 12.10 | 15.57 | 10.84 | 13.44 | 12.40 |
| Basic EPS (₹) | 12.80 | 18.80 | 8.98 | 12.37 | 11.98 |
All figures in Rs Cr, unless mentioned otherwise
Contingent Liabilities Coverage
Company has sufficient cash reserves to pay off its contingent liabilities. (Source: Standalone Financials)| Annual | FY 2024 | FY 2023 | FY 2022 | FY 2021 | FY 2020 |
|---|---|---|---|---|---|
| Total Assets | 2,987.58 | 2,556.53 | 2,193.79 | 1,888.49 | 1,980.43 |
| Total Assets Growth (%) | 16.86 | 16.53 | 16.17 | -4.64 | 11.53 |
| Total Liabilities | 570.32 | 519.36 | 536.85 | 544.98 | 403.76 |
| Total Liabilities Growth (%) | 9.81 | -3.26 | -1.49 | 34.98 | -7.18 |
| Total Equity | 2,417.26 | 2,037.17 | 1,656.94 | 1,343.51 | 1,576.67 |
| Total Equity Growth (%) | 18.66 | 22.95 | 23.33 | -14.79 | 17.60 |
| Current Ratio (x) | 3.91 | 3.77 | 2.89 | 2.16 | 3.62 |
| Total Debt to Equity (x) | 0.00 | 0.01 | 0.02 | 0.02 | 0.01 |
| Contingent Liabilities | 322.98 | 265.61 | 47.33 | 36.42 | 67.99 |
All figures in Rs Cr, unless mentioned otherwise
Increase in Cash from Investing
Company has used Rs 228.05 cr for investing activities which is an YoY increase of 383.56%. (Source: Standalone Financials)| Annual | FY 2024 | FY 2023 | FY 2022 | FY 2021 | FY 2020 |
|---|---|---|---|---|---|
| Net Cash flow from Operating Activities | 339.92 | 341.16 | 32.89 | 188.71 | 348.17 |
| Net Cash used in Investing Activities | -228.05 | -47.16 | -76.10 | -68.74 | -101.88 |
| Net Cash flow from Financing Activities | -17.37 | -15.29 | -14.71 | -378.75 | -13.49 |
| Net Cash Flow | 94.41 | 280.55 | -56.66 | -257.41 | 230.19 |
| Closing Cash & Cash Equivalent | 488.70 | 394.29 | 113.75 | 170.40 | 427.82 |
| Closing Cash & Cash Equivalent Growth (%) | 23.94 | 246.64 | -33.25 | -60.17 | 116.47 |
| Total Debt/ CFO (x) | 0.02 | 0.09 | 0.91 | 0.17 | 0.06 |
All figures in Rs Cr, unless mentioned otherwise
| Annual | FY 2024 | FY 2023 | FY 2022 | FY 2021 | FY 2020 |
|---|---|---|---|---|---|
| Return on Equity (%) | 16.22 | 19.18 | 19.74 | 10.65 | 15.60 |
| Return on Capital Employed (%) | 20.99 | 24.71 | 25.06 | 13.54 | 18.27 |
| Return on Assets (%) | 13.12 | 15.28 | 14.91 | 7.58 | 12.42 |
| Interest Coverage Ratio (x) | 161.83 | 218.11 | 214.54 | 136.37 | 112.36 |
| Asset Turnover Ratio (x) | 1.05 | 1.18 | 1.08 | 74.69 | 81.64 |
| Price to Earnings (x) | 54.95 | 53.76 | 49.50 | 68.03 | 23.26 |
| Price to Book (x) | 8.88 | 10.26 | 9.77 | 7.25 | 3.63 |
| EV/EBITDA (x) | 34.49 | 33.84 | 30.87 | 35.37 | 13.79 |
| EBITDA Margin (%) | 21.07 | 21.86 | 23.82 | 19.23 | 23.87 |
Bullish / Bearish signals for Timken India basis selected technical indicators and moving average crossovers.
5 Day EMA Crossover
Bearish signal on daily chart
Appeared on: 17 Sep 2024
5D EMA: 3768.65
| Date | 7 days Gain/Loss % |
|---|---|
| 13 Sep 2024 | False Signal |
| 5 Sep 2024 | -4.08% |
| 28 Aug 2024 | -2.44% |
| 9 Aug 2024 | -8.14% |
Average price decline of -3.10% within 7 days of Bearish signal in last 5 years
10 Day EMA Crossover
Bearish signal on daily chart
Appeared on: 17 Sep 2024
10D EMA: 3767.45
| Date | 7 days Gain/Loss % |
|---|---|
| 13 Sep 2024 | False Signal |
| 6 Sep 2024 | -1.47% |
| 28 Aug 2024 | -2.44% |
| 9 Aug 2024 | -8.14% |
Average price decline of -2.83% within 7 days of Bearish signal in last 5 years
| R1 | R2 | R3 | PIVOT | S1 | S2 | S3 | |
|---|---|---|---|---|---|---|---|
| Classic | 3778.72 | 3798.38 | 3838.58 | 3758.18 | 3738.52 | 3717.98 | 3677.78 |
| 5 DAYS | 14 DAYS | 28 DAYS | |
|---|---|---|---|
| ATR | 89.95 | 116.94 | 135.38 |
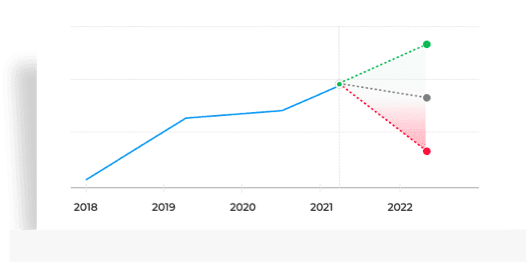
Stock Returns vs Nifty Midcap 100
Stock gave a 3 year return of 123.38% as compared to Nifty Midcap 100 which gave a return of 101.28%. (as of last trading session)Stock Returns vs BSE Industrials
Stock generated 123.38% return as compared to BSE Industrials which gave investors 204.04% return over 3 year time period. (as of last trading session)Choose from Peers
Choose from Stocks
455.49
Amount Invested (in Cr.)
0.75%
% of AUM
0.00
% Change (MoM basis)
416.46
Amount Invested (in Cr.)
0.55%
% of AUM
0.00
% Change (MoM basis)
294.36
Amount Invested (in Cr.)
0.77%
% of AUM
0.00
% Change (MoM basis)
MF Ownership as on 31 August 2024
| Meeting Date | Announced on | Purpose | Details |
|---|---|---|---|
| Aug 08, 2024 | Jul 12, 2024 | Board Meeting | Quarterly Results |
| May 09, 2024 | Apr 24, 2024 | Board Meeting | Audited Results & Final Dividend |
| Feb 06, 2024 | Jan 12, 2024 | Board Meeting | Quarterly Results |
| Nov 10, 2023 | Oct 26, 2023 | Board Meeting | Quarterly Results |
| Aug 21, 2023 | Jun 30, 2023 | AGM | - |
| Type | Dividend | Dividend per Share | Ex-Dividend Date | Announced on |
|---|---|---|---|---|
| Final | 25% | 2.5 | Jul 26, 2024 | May 09, 2024 |
| Final | 15% | 1.5 | Aug 04, 2023 | May 17, 2023 |
| Final | 15% | 1.5 | Aug 11, 2022 | May 27, 2022 |
| Final | 15% | 1.5 | Jul 29, 2021 | Jun 18, 2021 |
| Final | 500% | 50.0 | Jul 23, 2020 | Jun 05, 2020 |
| All Types | Ex-Date | Record Date | Announced on | Details |
|---|---|---|---|---|
| Rights | Jan 03, 1994 | Jan 18, 1994 | Dec 18, 1994 | Rights ratio: 1 share for every 2 held at a price of Rs 10.0 |
Timken India Ltd., incorporated in the year 1996, is a Mid Cap company (having a market cap of Rs 28,275.10 Crore) operating in Engineering sector. Timken India Ltd. key Products/Revenue Segments include Bearings, Sale of services, Export Incentives for the year ending 31-Mar-2024. Show More
Sanjay Koul
Chairman & Managing DirectorSanjay Koul
Chairman & Managing DirectorAvishrant Keshava
WholeTime Director & CFOAvishrant Keshava
WholeTime Director & CFOIndustry
Key Indices Listed on
Nifty 500, BSE 500, Nifty MNC, + 16 more
Address
No. 39-42, Electronic City,Phase II, Hosur Road,Bengaluru, Karnataka - 560100
DATA SOURCES: TickerPlant (for live BSE/NSE quotes service) and Dion Global Solutions Ltd. (for corporate data, historical price & volume, F&O data). Sensex & BSE Quotes and Nifty & NSE Quotes are real-time and licensed from BSE and NSE respectively. All timestamps are reflected in IST (Indian Standard Time).
DISCLAIMER: Any and all content on this website including tools/analysis is provided to you only for convenience and on an “as-is, as- available” basis without representation and warranties of any kind. The content and any output of such tools/analysis is for informational purposes only and should not be relied upon or construed as an investment advice or guarantee for any specific performance/returns advice or considered as recommendation for the purchase or sale of any security or investment. You are advised to exercise caution, discretion and independent judgment with regards to the same and seek advice from professionals and certified experts before taking any decisions.
By using this site, you agree to the Terms of Service and Privacy Policy.