Adani Wilmar Share Price

  • 353.55-4.35 (-1.22%)
  • Volume: 16,20,308
  • Closed
  • Last Updated On: 18 Sep, 2024, 04:00 PM IST
Loading...

Adani Wilmar Share Price

  • 353.55-4.35 (-1.22%)
  • Volume: 16,20,308
Advertisment

Adani Wilmar share price insights

View All
  • In the last 2 years, only 3.39 % trading sessions saw intraday declines higher than 5 % .

  • Sales de-grew by 11.79%. Company witnessed revenue contraction for the first time in last 3 years. (Source: Consolidated Financials)

  • 200 day moving crossover appeared on Sep 17, 2024. Average price decline of -10.46% within 30 days of this signal in last 5 years.

  • Company has spent 1.46% of its operating revenues towards interest expenses and 0.82% towards employee cost in the year ending Mar 31, 2024. (Source: Consolidated Financials)

  • Adani Wilmar Ltd. share price moved down by -1.22% from its previous close of Rs 357.90. Adani Wilmar Ltd. stock last traded price is 353.55

    Share PriceValue
    Today/Current/Last353.55
    Previous Day357.90358.10

InsightsAdani Wilmar

    Do you find these insights useful?

    • hate it

    • meh

    • love it

    Key Metrics

    PE Ratio
    (x)
    85.08
    EPS - TTM
    (₹)
    4.16
    MCap
    (₹ Cr.)
    46,515.50
    Sectoral MCap Rank
    12
    PB Ratio
    (x)
    5.59
    Div Yield
    (%)
    0.00
    Face Value
    (₹)
    1.00
    Beta

    Beta

    1 Month-
    3 Months-
    6 Months-
    1 Year-
    3 Years-

    -
    VWAP
    (₹)
    355.94
    52W H/L
    (₹)
    410.50 / 285.80

    Adani Wilmar Share Price Returns

    1 Day-1.22%
    1 Week-1.02%
    1 Month-2.68%
    3 Months3.51%
    1 Year0.55%
    3 YearsN.A.
    5 YearsN.A.

    ET Stock ScreenersTop Score Companies

    Check whether Adani Wilmar belongs to analysts' top-rated companies list?

    View Stock Screeners

    Adani Wilmar Share Analysis

    Unlock Stock Score, Analyst' Ratings & Recommendations

    Share Analysis Non Prime User
    • View Stock Score on a 10-point scale
    • See ratings on Earning, Fundamentals, Valuation, Risk & Price
    • Check stock performance
    JOIN ET PRIME

    Adani Wilmar Share Recommendations

    Recent Recos

    HOLD

    Current

    Mean Recos by 5 Analysts

    Strong
    Sell
    SellHoldBuyStrong
    Buy
    • Target₹550
    • OrganizationICICI Securities
    • HOLD

    Analyst Trends

    RatingsCurrent1 Week Ago1 Month Ago3 Months Ago
    Strong Buy----
    Buy2222
    Hold2221
    Sell1111
    Strong Sell----
    # Analysts5554

    Adani Wilmar Financials

    • Insights

      • Topline Contraction

        Sales de-grew by 11.79%. Company witnessed revenue contraction for the first time in last 3 years. (Source: Consolidated Financials)
      • Employee & Interest Expense

        Company has spent 1.46% of its operating revenues towards interest expenses and 0.82% towards employee cost in the year ending Mar 31, 2024. (Source: Consolidated Financials)
      Quarterly | AnnualJun 2024Mar 2024Dec 2023Sep 2023Jun 2023
      Total Income14,229.8713,342.2612,887.6012,331.2012,994.18
      Total Income Growth (%)6.653.534.51-5.10-6.82
      Total Expenses13,646.1312,960.2412,419.5712,272.7312,891.19
      Total Expenses Growth (%)5.294.351.20-4.80-5.25
      EBIT583.74382.02468.0358.47102.99
      EBIT Growth (%)52.80-18.38700.46-43.23-69.65
      Profit after Tax (PAT)313.20156.75200.89-130.73-78.92
      PAT Growth (%)99.81-21.97---184.31
      EBIT Margin (%)4.102.863.630.470.79
      Net Profit Margin (%)2.201.171.56-1.06-0.61
      Basic EPS (₹)2.411.211.55-1.01-0.61
      Quarterly | AnnualJun 2024Mar 2024Dec 2023Sep 2023Jun 2023
      Total Income13,810.1212,806.9312,499.0311,783.0812,443.49
      Total Income Growth (%)7.832.466.08-5.31-5.68
      Total Expenses13,227.6012,439.6211,995.4011,702.1212,339.79
      Total Expenses Growth (%)6.333.702.51-5.17-4.07
      EBIT582.52367.31503.6380.96103.70
      EBIT Growth (%)58.59-27.07522.07-21.93-68.54
      Profit after Tax (PAT)323.55156.32247.33-87.05-38.44
      PAT Growth (%)106.98-36.80---139.34
      EBIT Margin (%)4.222.874.030.690.83
      Net Profit Margin (%)2.341.221.98-0.74-0.31
      Basic EPS (₹)2.491.201.90-0.67-0.30
      Quarterly | Annual FY 2024 FY 2023 FY 2022 FY 2021 FY 2020
      Total Revenue51,555.2458,446.1654,385.8937,195.6629,766.99
      Total Revenue Growth (%)-11.797.4746.2224.962.93
      Total Expenses51,239.3357,657.2453,327.1336,439.0229,157.97
      Total Expenses Growth (%)-11.138.1246.3524.972.84
      Profit after Tax (PAT)147.99582.12803.73727.65460.87
      PAT Growth (%)-74.58-27.5710.4657.8922.73
      Operating Profit Margin (%)2.072.682.953.133.97
      Net Profit Margin (%)0.281.001.481.961.55
      Basic EPS (₹)1.144.486.896.374.03
      Quarterly | Annual FY 2024 FY 2023 FY 2022 FY 2021 FY 2020
      Total Revenue49,532.5355,519.1552,529.9537,194.4329,764.92
      Total Revenue Growth (%)-10.785.6941.2324.962.91
      Total Expenses49,097.7954,694.5051,445.5736,436.9829,156.28
      Total Expenses Growth (%)-10.236.3241.1924.972.84
      Profit after Tax (PAT)278.16607.23807.94654.56394.60
      PAT Growth (%)-54.19-24.8423.4365.888.06
      Operating Profit Margin (%)2.252.813.073.134.02
      Net Profit Margin (%)0.561.091.541.761.33
      Basic EPS (₹)2.144.676.9257.2734.53

      All figures in Rs Cr, unless mentioned otherwise

    • Annual FY 2024 FY 2023 FY 2022 FY 2021 FY 2020
      Total Assets19,806.5320,979.7821,317.2613,326.6411,785.92
      Total Assets Growth (%)-5.59-1.5859.9613.071.58
      Total Liabilities11,490.5412,814.0313,710.8910,028.509,215.22
      Total Liabilities Growth (%)-10.33-6.5436.728.83-2.91
      Total Equity8,315.998,165.757,606.373,298.142,570.70
      Total Equity Growth (%)1.847.35130.6328.3021.78
      Current Ratio (x)1.221.241.241.041.00
      Total Debt to Equity (x)0.290.270.340.490.84
      Contingent Liabilities947.041,012.68636.31719.97835.77
      Annual FY 2024 FY 2023 FY 2022 FY 2021 FY 2020
      Total Assets18,802.8519,618.8320,251.3113,075.4711,625.86
      Total Assets Growth (%)-4.16-3.1254.8812.472.07
      Total Liabilities10,530.8211,630.5212,873.4310,008.749,213.51
      Total Liabilities Growth (%)-9.46-9.6528.628.63-1.68
      Total Equity8,272.037,988.317,377.883,066.732,412.35
      Total Equity Growth (%)3.558.27140.5827.1319.49
      Current Ratio (x)1.291.301.281.041.00
      Total Debt to Equity (x)0.260.270.340.530.90
      Contingent Liabilities541.74649.29627.22243.00-

      All figures in Rs Cr, unless mentioned otherwise

    • Annual FY 2024 FY 2023 FY 2022 FY 2021 FY 2020
      Net Cash flow from Operating Activities288.92663.301,159.96926.01781.30
      Net Cash used in Investing Activities142.16532.57-3,861.22-483.80-506.38
      Net Cash flow from Financing Activities-563.39-919.062,691.47-730.96-7.77
      Net Cash Flow-136.23267.7669.82-288.75267.14
      Closing Cash & Cash Equivalent258.60394.83127.0757.25346.00
      Closing Cash & Cash Equivalent Growth (%)-34.50210.72121.95-83.45338.77
      Total Debt/ CFO (x)8.363.362.211.762.77
      Annual FY 2024 FY 2023 FY 2022 FY 2021 FY 2020
      Net Cash flow from Operating Activities366.42513.891,154.33940.91793.43
      Net Cash used in Investing Activities139.27599.18-3,848.09-499.10-520.20
      Net Cash flow from Financing Activities-619.35-919.452,715.74-730.66-5.40
      Net Cash Flow-114.19190.2421.98-288.85267.83
      Closing Cash & Cash Equivalent155.01269.2078.9656.99345.84
      Closing Cash & Cash Equivalent Growth (%)-42.42240.9338.55-83.52343.34
      Total Debt/ CFO (x)5.934.132.171.732.72

      All figures in Rs Cr, unless mentioned otherwise

    • Annual FY 2024 FY 2023 FY 2022 FY 2021 FY 2020
      Return on Equity (%)1.777.1210.5622.0617.92
      Return on Capital Employed (%)11.3316.8218.8023.2426.40
      Return on Assets (%)0.742.773.775.463.91
      Interest Coverage Ratio (x)1.912.483.533.522.49
      Asset Turnover Ratio (x)2.512.703.122.982.55
      Price to Earnings (x)285.7190.9184.03--
      Price to Book (x)5.026.468.84--
      EV/EBITDA (x)28.9326.6734.23--
      EBITDA Margin (%)2.783.303.523.854.78
      Annual FY 2024 FY 2023 FY 2022 FY 2021 FY 2020
      Return on Equity (%)3.367.6010.9521.3416.35
      Return on Capital Employed (%)11.9417.1819.6524.3827.84
      Return on Assets (%)1.473.093.985.003.39
      Interest Coverage Ratio (x)2.122.573.613.522.45
      Asset Turnover Ratio (x)2.562.773.143.002.58
      Price to Earnings (x)151.5286.9683.33--
      Price to Book (x)5.056.619.12--
      EV/EBITDA (x)28.8327.4234.48--
      EBITDA Margin (%)2.903.383.613.854.84

    Financial InsightsAdani Wilmar

    • Income (P&L)
      • Topline Contraction

        Sales de-grew by 11.79%. Company witnessed revenue contraction for the first time in last 3 years. (Source: Consolidated Financials)

      • Employee & Interest Expense

        Company has spent 1.46% of its operating revenues towards interest expenses and 0.82% towards employee cost in the year ending Mar 31, 2024. (Source: Consolidated Financials)

    Do you find these insights useful?

    • hate it

    • meh

    • love it

    Adani Wilmar Share Price Forecast

    • Get multiple analysts’ prediction on Adani Wilmar

      Stock Forecast Non Prime User
      • High, low, medium predictions for Price
      • Upcoming predictions for Revenue
      • Details about company earnings
      START FREE TRIAL
    • Get multiple analysts’ prediction on Adani Wilmar

      Stock Forecast Non Prime User
      • High, low, medium predictions for Price
      • Upcoming predictions for Revenue
      • Details about company earnings
      START FREE TRIAL
    • Get multiple analysts’ prediction on Adani Wilmar

      Stock Forecast Non Prime User
      • High, low, medium predictions for Price
      • Upcoming predictions for Revenue
      • Details about company earnings
      START FREE TRIAL

    Adani Wilmar Technicals

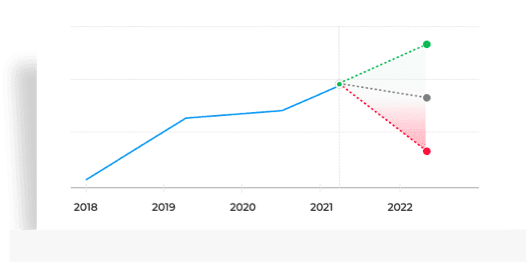
    • Bullish / Bearish signals for Adani Wilmar basis selected technical indicators and moving average crossovers.

      5 Day EMA Crossover

      Bearish signal on daily chart

      Appeared on: 17 Sep 2024

      5D EMA: 361.14

      Last 4 Sell Signals:13 Sep 2024
      Date7 days Gain/Loss %
      13 Sep 2024False Signal
      5 Sep 2024-3.03%
      3 Sep 2024-1.23%
      27 Aug 2024-3.46%

      Average price decline of -4.20% within 7 days of Bearish signal in last 5 years

      10 Day EMA Crossover

      Bearish signal on daily chart

      Appeared on: 17 Sep 2024

      10D EMA: 362.73

      Last 4 Sell Signals:5 Sep 2024
      Date7 days Gain/Loss %
      5 Sep 2024-3.03%
      3 Sep 2024-1.23%
      28 Aug 2024-1.68%
      12 Aug 2024-4.84%

      Average price decline of -4.52% within 7 days of Bearish signal in last 5 years

      Show More
    • 33%
      Positive Movement since
      1st Jan 2005 on basis
      64%
      Negative Movement since
      1st Jan 2005 on basis
      Exclude
    • Pivot Levels

      R1R2R3PIVOTS1S2S3
      Classic358.40363.25371.05355.45350.60347.65339.85

      Average True Range

      5 DAYS14 DAYS28 DAYS
      ATR10.2512.0412.48

    Adani Wilmar Peer Comparison

      • 1D
      • 1W
      • 1M
      • 3M
      • 6M
      • 1Y
      • 5Y
      Loading...
    • Ratio Performance

      NAMEP/E (x)P/B (x)ROE %ROCE %ROA %Rev CAGR [3Yr]OPMNPMBasic EPSCurrent RatioTotal Debt/ Equity (x)Total Debt/ CFO (x)
      Adani Wilmar85.085.531.7711.330.7411.372.070.331.141.220.298.36
      Patanjali Foods69.65-13.040.00-1.08-0.1224.670.42-0.69-0.320.20-1.7536.59
      Bikaji Foods Inter81.4318.9221.8027.2417.3221.0115.3911.3110.632.280.100.49
      LT Foods23.954.2617.5921.249.8118.4210.737.0617.092.080.160.70
      Zydus Wellness44.802.544.985.544.347.6012.8111.4641.941.620.061.31
      Add More
      Annual Ratios (%)

      Choose from Peers

      • Mrs. Bectors Food Specialities
      • Tasty Bite Eatable
      • ADF Foods
      • Prataap Snacks
      • Euro India Fresh

      Choose from Stocks

      Peers InsightsAdani Wilmar

        Do you find these insights useful?

        • hate it

        • meh

        • love it

        Adani Wilmar Shareholding Pattern

        • Loading...
          Showing Adani Wilmar Shareholding as on 30 Jun 2024
          Category30 Jun 202431 Mar 202431 Dec 202330 Sep 2023
          Promoters87.8787.8787.8787.94
          Pledge0.000.000.000.00
          FII0.730.770.650.63
          DII0.250.290.120.06
          Mutual Funds0.030.030.060.06
          Others11.1411.0611.3511.37
        • Showing Shareholding as on 30 Jun 2024
          CategoryNo. of SharesPercentage% Change QoQ
          Promoters1,14,20,38,87087.87 %0.00
          Pledge00.00 %0.00
          FII95,12,4720.73 %-0.04
          DII32,69,9890.25 %-0.04
          MF4,09,1650.03 %0.00
          Others14,48,57,27411.14 %0.07

        Adani Wilmar MF Ownership

        MF Ownership details are not available.

        Adani Wilmar Corporate Actions

        • Meeting DateAnnounced onPurposeDetails
          Jul 29, 2024Jul 19, 2024Board MeetingQuarterly Results
          May 01, 2024Apr 24, 2024Board MeetingAudited Results
          Jan 31, 2024Jan 23, 2024Board MeetingQuarterly Results
          Jan 29, 2024Dec 27, 2023POM-
          Nov 01, 2023Oct 25, 2023Board MeetingQuarterly Results
        • Dividend announcements are not available.

        • No other corporate actions details are available.

        About Adani Wilmar

        Adani Wilmar Ltd., incorporated in the year 1999, is a Small Cap company (having a market cap of Rs 45,950.14 Crore) operating in FMCG sector. Adani Wilmar Ltd. key Products/Revenue Segments include Edible Oil, Export Incentives, Scrap, Commission and Royalty Income for the year ending 31-Mar-2024. Show More

        • Executives

        • Auditors

        • DM

          Dorab Mistry

          Non Exe.Chairman&Ind.Director
          KK

          Kuok Khoon Hong

          Non Executive Vice Chairman
          AM

          Angshu Mallick

          Managing Director & CEO
          RK

          Ravindra Kumar Singh

          Whole Time Director
          Show More
        • SRBC & Co. LLP
          Dharmesh Parikh & Co. LLP
          Shah Dhandharia & Co. LLP
          Shah Dhandharia & Co.

        FAQs about Adani Wilmar share

        • 1. What is Adani Wilmar share price and what are the returns for Adani Wilmar share?
          Adani Wilmar share price was Rs 353.55 as on 18 Sep, 2024, 04:00 PM IST. Adani Wilmar share price was down by 1.22% based on previous share price of Rs. 365.6.
        • 2. Who is the chairman of Adani Wilmar?
          Dorab Mistry is the Non Exe.Chairman&Ind.Director of Adani Wilmar
        • 3. Who are the key owners of Adani Wilmar stock?
          Promoter,DII and FII owns 87.87, 0.29 and 0.77 shares of Adani Wilmar as on 30 Jun 2024
          • There is no change in promoter holding from 31 Mar 2024 to 30 Jun 2024
          • Domestic Institutional Investors holding have gone down from 0.29 (31 Mar 2024) to 0.25 (30 Jun 2024)
          • Foreign Institutional Investors holding have gone down from 0.77 (31 Mar 2024) to 0.73 (30 Jun 2024)
          • Other investor holding has gone up from 11.06 (31 Mar 2024) to 11.14 (30 Jun 2024)
        • 4. What is Adani Wilmar's 52 week high / low?
          52 Week high of Adani Wilmar share is Rs 410.50 while 52 week low is Rs 285.80
        • 5. What is the market cap of Adani Wilmar?
          Within the FMCG sector, Adani Wilmar stock has a market cap rank of 12. Adani Wilmar has a market cap of Rs 46,515.50 Cr.
        • 6. Who are peers to compare Adani Wilmar share price?
          Top 10 Peers for Adani Wilmar are Patanjali Foods Ltd., Bikaji Foods International Ltd., Zydus Wellness Ltd., LT Foods Ltd., Mrs. Bectors Food Specialities Ltd., Tasty Bite Eatables Ltd., ADF Foods Ltd., Prataap Snacks Ltd., Euro India Fresh Foods Ltd. and Sheetal Cool Products Ltd.
        • 7. Who is the Chief Executive Officer of Adani Wilmar?
          Angshu Mallick is the Managing Director & CEO of Adani Wilmar
        • 8. What are the key metrics to analyse Adani Wilmar Share Price?
          Key Metrics for Adani Wilmar are:
          • PE Ratio of Adani Wilmar is 85.08
          • Price/Sales ratio of Adani Wilmar is 0.81
          • Price to Book ratio of Adani Wilmar is 5.59
        • 9. What are the Adani Wilmar quarterly results?
          On Consoldiated basis, Adani Wilmar reported a total income and profit of Rs 14229.87 Cr and Rs 313.20 respectively for quarter ending 2024-06-30. Total Income and profit for the year ending 2024-03-31 was Rs 51555.24 Cr and Rs 147.99 Cr.
        • 10. What are the returns for Adani Wilmar share?
          Return Performance of Adani Wilmar Shares:
          • 1 Week: Adani Wilmar share price moved down by 1.02%
        • 11. What is the CAGR of Adani Wilmar?
          The CAGR of Adani Wilmar is 8.43.
        • 12. What is the PE & PB ratio of Adani Wilmar?
          The PE ratio of Adani Wilmar stands at 86.12, while the PB ratio is 5.59.

        Trending in Markets

        Top Gainers As on 04:00 PM | 18 Sep 2024

        BSE3,896.15
        562.46 (16.88%)
        Graphite India586.35
        49.96 (9.32%)
        HEG2,290.50
        182.06 (8.64%)
        Torrent Power1,932.90
        152.86 (8.59%)
        Alkyl Amines2,367.05
        149.56 (6.75%)

        Top Losers As on 04:03 PM | 18 Sep 2024

        Oracle11,259.50
        -1020.96 (-8.32%)
        Blue Dart8,574.15
        -679.50 (-7.35%)
        Mphasis3,004.40
        -173.41 (-5.46%)
        JM Financial125.43
        -6.16 (-4.68%)
        Triveni Engg479.75
        -21.61 (-4.31%)

        DATA SOURCES: TickerPlant (for live BSE/NSE quotes service) and Dion Global Solutions Ltd. (for corporate data, historical price & volume, F&O data). Sensex & BSE Quotes and Nifty & NSE Quotes are real-time and licensed from BSE and NSE respectively. All timestamps are reflected in IST (Indian Standard Time).

        DISCLAIMER: Any and all content on this website including tools/analysis is provided to you only for convenience and on an “as-is, as- available” basis without representation and warranties of any kind. The content and any output of such tools/analysis is for informational purposes only and should not be relied upon or construed as an investment advice or guarantee for any specific performance/returns advice or considered as recommendation for the purchase or sale of any security or investment. You are advised to exercise caution, discretion and independent judgment with regards to the same and seek advice from professionals and certified experts before taking any decisions.

        By using this site, you agree to the Terms of Service and Privacy Policy.

        The Economic Times