LinkedIn’s Q4 2011 Earnings Announcement
•
16 likes•168,763 views

We’d like to share with you the announcement related to our Q4 2011 earnings. We’ll also be live sharing the earnings call both from LinkedIn’s Company Page and our @linkedin account, starting 2PM today, Feb 9.
Report
Share
Related slideshows


LinkedIn’s Q4 2011 Earnings Announcement
- 2. Safe Harbor This presentation contains forward-looking statements about expected future events and financial results, including statements regarding our member growth, our products and product strategy, including our Talent Pipeline Solution, our employees and recruiting efforts, including investments in our sales force, the markets we serve, our planned investments in key strategic areas, and our expected financial metrics such as revenue, adjusted EBITDA, depreciation and amortization and stock-based compensation for the first quarter of 2012 and the full fiscal year 2012. The achievement or success of the matters covered by such forward-looking statements involves risks, uncertainties and assumptions. If any such risks or uncertainties materialize or if any of the assumptions prove incorrect, the company’s results could differ materially from the results expressed or implied by the forward-looking statements the company makes. The risks and uncertainties referred to above include - but are not limited to - risks associated with: the company’s short operating history in a new and unproven market; engagement of its members; the price volatility of our Class A common stock, including in connection with the release of any restrictions on trading in the company’s stock; general economic conditions; expectations regarding the return on our strategic investments; execution of our plans and strategies; expectations regarding the company’s ability to timely and effectively scale and adapt existing technology and network infrastructure to ensure that its website is accessible at all times with short or no perceptible load times; security measures and the risk that the company’s website may be subject to attacks that degrade or deny the ability of members to access the company’s solutions; members and customers curtailing or ceasing to use the company’s solutions; the company’s core value of putting members first, which may conflict with the short-term interests of the business; privacy issues; increasing competition in the market for online professional networks; and the dual class structure of the company’s common stock. Further information on these and other factors that could affect the company’s financial results is included in filings it makes with the Securities and Exchange Commission from time to time, including the section entitled “Risk Factors” in the company’s Form 10-Q that was filed for the quarter ended September 30, 2011, and additional information will also be set forth in our Annual Report on Form 10-K for the year ended December 31, 2011. These documents are available on the SEC Filings section of the Investor Information section of the company’s website at http://investors.linkedin.com/. All information provided in this release and in the attachments is as of February 9, 2012, and LinkedIn undertakes no duty to update this information. To supplement its consolidated financial statements, which are prepared and presented in accordance with GAAP, the company uses the following non-GAAP financial measures: adjusted EBITDA, non-GAAP net income, and non-GAAP EPS (collectively the “non-GAAP financial measures”), which exclude certain items such as stock-based compensation expense, amortization of intangible assets and the tax impact of these adjustments. The presentation of this financial information is not intended to be considered in isolation or as a substitute for, or superior to, the financial information prepared and presented in accordance with GAAP. The company uses these non-GAAP financial measures for financial and operational decision making and as a means to evaluate period-to-period comparisons. The company believes that they provide useful information about operating results, enhance the overall understanding of past financial performance and future prospects, and allow for greater transparency with respect to key metrics used by management in its financial and operational decision making. As required by SEC rules, we have provided a reconciliation of the non-GAAP financial measures included in this presentation to the most directly comparable GAAP measures. This presentation, including the reconciliation, will be available on the investor relations portion of our website at www.linkedin.com. 2
- 3. Jeff Weiner 1st Chief Executive Officer at LinkedIn San Francisco Bay Area | Internet Send Message View Profile Steve Sordello 1st Chief Financial Officer at LinkedIn San Francisco Bay Area | Internet Send Message View Profile 3
- 4. Key Metrics (Millions) (Millions) (Billions) 160 100 145 8 7.6 7.6 92 88 7.1 7.1 140 131 82 120 116 80 75 6 5.5 102 5.0 100 65 90 60 3.9 81 4 3.6 80 53 72 64 46 45 60 40 2 40 20 20 0 Q2'10 Q4'10 Q2'11 Q4'11 Q1'10 Q3'10 Q1'11 Q3'11 Q1'10 Q1'11 Q4'11 Q2'10 Q3'10 Q4'10 Q2'11 Q3'11 Q1'10 Q2'10 Q3'10 Q4'10 Q1'11 Q2'11 Q3'11 Q4'11 Members (MM) Unique Visitors, comScore (MM) Page Views, comScore (BN) 4
- 5. Revenue (Millions) $180 130% $168 $160 120% $139 110% $140 $121 100% $120 90% $100 $94 80% $82 $80 70% $62 $60 $55 60% $45 $39 $40 50% $28 $30 $23 $20 40% Q1'09 Q2'09 Q3'09 Q4'09 Q1'10 Q2'10 Q3'10 Q4'10 Q1'11 Q2'11 Q3'11 Q4'11 Net Revenue ($MM) % y/y 5
- 6. (Millions) Revenue by Product $180 $168 $160 20% $139 $140 20% $121 30% $120 20% 29% $100 $94 32% $82 21% $80 50% 22% $62 30% 51% $60 $55 34% 25% $45 48% $39 27% $40 30% 31% 49% $28 $30 32% 33% $23 44% 38% 32% $20 39% 37% 44% 47% 40% 26% 32% 30% 38% 27% 29% 31% 32% $- Q1'09 Q2'09 Q3'09 Q4'09 Q1'10 Q2'10 Q3'10 Q4'10 Q1'11 Q2'11 Q3'11 Q4'11 Premium Subscriptions Marketing Solutions Hiring Solutions 6
- 7. (Millions) Revenue by Geography $180 $168 $160 33% $139 $140 33% $121 $120 32% 67% $100 $94 $82 31% 67% $80 68% 29% $62 $60 $55 69% 26% $45 27% 71% $39 $40 27% 74% $28 $30 28% 73% $23 27% 25% 73% $20 25% 72% 73% 75% 75% $- Q1'09 Q2'09 Q3'09 Q4'09 Q1'10 Q2'10 Q3'10 Q4'10 Q1'11 Q2'11 Q3'11 Q4'11 International US 7
- 8. (Millions) Revenue by Channel $180 $168 $160 43% $139 $140 47% $121 $120 45% $100 $94 $82 46% 57% $80 41% $62 53% $60 $55 55% 46% $45 45% $39 54% $40 59% 47% $28 $30 43% $23 54% 46% 50% 55% $20 50% 53% 57% 54% 50% 50% $- Q1'09 Q2'09 Q3'09 Q4'09 Q1'10 Q2'10 Q3'10 Q4'10 Q1'11 Q2'11 Q3'11 Q4'11 Online Sales Field Sales 8
- 9. Adjusted EBITDA & Margin (Millions) $35 $34.4 25% $30 $26.3 20% $24.7 $25 15% $20 $16.3 $15 $13.3 10% $11.5 $11.1 $10 $9.1 $5.3 5% $4.4 $5 $3.7 $1.3 $0 0% Q1'09 Q2'09 Q3'09 Q4'09 Q1'10 Q2'10 Q3'10 Q4'10 Q1'11 Q2'11 Q3'11 Q4'11 Adjusted EBITDA Margin% 9
- 10. Net Income & Cash Flow Highlights Q4 2011 Q3 2011 Q4 2010 Net Income (Loss) $mn, GAAP $6.9 $(1.6) $5.3 Net Income $mn, Non-GAAP $13.3 $6.6 $5.2 EPS, GAAP Fully-Diluted Weighted Shares * Excludes both net income attributable to preferred shareholders & $0.06 $(0.02) $0.03 preferred shares in share count EPS, Non-GAAP Fully-Diluted Weighted Shares $0.12 $0.06 $0.05 Operating Cash Flow (OCF) $24.2 $46.7 $16.4 Free Cash Flow, $mn (OCF – Purchases of PPE) $3.5 $17.9 $2.6 Cash, Cash Equivalents, & ST Investments, $mn $577.5 $387.7 $93.0 For additional reconciliation of our non-GAAP measures, please see the “Selected Company Metrics and Financials” page on LinkedIn’s Investor Relations site. 10
- 11. Guidance Q1 2012 FY 2012 Revenue, $mn $170-175 $840-860 Adjusted EBITDA, $mn $25-27 $155-165 Depreciation & Amortization, $mn $15-17 $70-80 Stock-Based Compensation, $mn $13-14 $65-75 11
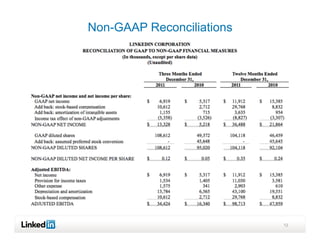
- 12. Non-GAAP Reconciliations 12
- 13. Thank You