LinkedIn Meetup - InMaps
•
6 likes•5,931 views

This is a presentation on the technology behind InMaps presented by Mathieu Bastian at a meetup organized at LinkedIn, Mountain View.
Report
Share


LinkedIn Meetup - InMaps
- 1. Data Visualization Group in Bay Area Meetup - April 2011 Mathieu Bastian, Data Scientist
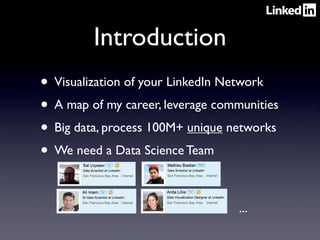
- 2. Introduction • Visualization of your LinkedIn Network • A map of my career, leverage communities • Big data, process 100M+ unique networks
- 3. Introduction • Visualization of your LinkedIn Network • A map of my career, leverage communities • Big data, process 100M+ unique networks • We need a Data Science Team ...
- 4. Interactive Visualization Demo inmaps.linkedinlabs.com
- 5. Manifesto • Visually attractive • Relevant • Interactive
- 6. Manifesto • Visually attractive • Relevant • Interactive ... And compatible with IE7+ and iPad
- 7. 1. Data processing • Pre compute what’s possible on Hadoop • Force Directed layout on millions graphs • Data stored on Voldemort • Stack in Ruby, Java, LinkedIn APIs
- 8. 2.Visualization • Large networks, 10 000+ bezier curves • We tried SVG, Canvas and more... • We took the Google Maps approach • Use images and add interactivity layer • Seadragon + RaphaelJS
- 9. Seadragon • Tiles (256px) • Zoom & Pan • IE6+
- 10. RaphaelJS • Interactive • SVG & VML • IE6+
- 11. Map Design • Layout and distances
- 12. Map Design • Curved edges and density
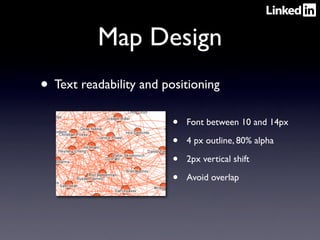
- 13. Map Design • Text readability and positioning • Font between 10 and 14px • 4 px outline, 80% alpha • 2px vertical shift • Avoid overlap