SlideShare a Scribd company logo
Q3’11 Results
Safe Harbor
“Safe Harbor” statement under the Private Securities Litigation Reform Act of 1995: This press release contains forward-looking
statements about our planned investments in key strategic areas, and our expected financial metrics such as revenue, adjusted
EBITDA, depreciation and amortization and stock-based compensation for the fourth quarter of 2011 and the full fiscal year .
The achievement or success of the matters covered by such forward-looking statements involves risks, uncertainties and
assumptions. If any such risks or uncertainties materialize or if any of the assumptions prove incorrect, the company’s results
could differ materially from the results expressed or implied by the forward-looking statements the company makes.

The risks and uncertainties referred to above include - but are not limited to - risks associated with the company’s short
operating history in a new and unproven market; engagement of its members; the price volatility of its Class A common stock;
expectations regarding the company’s ability to timely and effectively scale and adapt existing technology and network
infrastructure to ensure that its website is accessible at all times with short or no perceptible load times; security measures and
the risk that the company’s website may be subject to attacks that degrade or deny the ability of members to access the
company’s solutions; members and customers curtailing or ceasing to use the company’s solutions; the company’s core value
of putting members first, which may conflict with the short-term interests of the business; privacy issues; increasing competition
in the market for online professional networks; and the dual class structure of the company’s common stock.

Further information on these and other factors that could affect the company’s financial results is included in filings it makes with
the Securities and Exchange Commission from time to time, including the section entitled “Risk Factors” in the company’s Form
10-Q that will be filed for the quarter ended September 30, 2011. These documents are available on the SEC Filings section of
the Investor Information section of the company’s website at http://investors.linkedin.com/. All information provided in this
release and in the attachments is as of November 3, 2011, and LinkedIn undertakes no duty to update this information.


                                                                                                                                        2
Jeff Weiner           1st

Chief Executive Officer at LinkedIn
San Francisco Bay Area | Internet

 Send Message        View Profile


                                    Steve Sordello              1st
                                    Chief Financial Officer at LinkedIn
                                    San Francisco Bay Area | Internet

                                      Send Message        View Profile


                                                                          3
Key Metrics
(Millions)                                                                                     (Millions)                                                     (Billions)
140                                                                                           100
                                                                                      131                                                                     8                                                         7.6
                                                                                                                                                      88                                            7.1     7.1
120                                                                           116                                                             82
                                                                                               80
                                                                                                                                      75                      6
                                                                      102                                                                                                                   5.5
100                                                                                                                                                                                 5.0
                                                              90                                                              65
                                                      81
                                                                                               60                                                                           3.9
80                                                                                                                                                            4    3.6
                                              72                                                                      53
                                      64
                                                                                                      46      45
60                            55
                      48                                                                       40                                                             2
              42
40    37


20                                                                                             20                                                             0
                                                                                                      Q1'10

                                                                                                              Q2'10

                                                                                                                      Q3'10

                                                                                                                              Q4'10

                                                                                                                                      Q1'11

                                                                                                                                              Q2'11

                                                                                                                                                      Q3'11


                                                                                                                                                                    Q1'10

                                                                                                                                                                            Q2'10

                                                                                                                                                                                    Q3'10

                                                                                                                                                                                            Q4'10

                                                                                                                                                                                                    Q1'11

                                                                                                                                                                                                            Q2'11

                                                                                                                                                                                                                        Q3'11
      Q1'09
              Q2'09
                      Q3'09
                              Q4'09
                                      Q1'10
                                              Q2'10
                                                      Q3'10
                                                              Q4'10
                                                                      Q1'11
                                                                              Q2'11
                                                                                      Q3'11


                              Members, mn                                                                 Avg comScore Unique Visitors, mn                                  comScore Page Views, bns


                                                                                                                                                                                                                    4
Revenue
 (Millions)
                                                                                       $139
$140                                                                                           130%


                                                                               $121            120%
$120
                                                                                               110%

$100                                                                    $94                    100%


                                                                $82                            90%
$80
                                                                                               80%
                                                        $62
$60                                             $55                                            70%

                                        $45
                                                                                               60%
                                $39
$40
                $28     $30                                                                    50%
        $23
$20                                                                                            40%
       Q1'09   Q2'09   Q3'09   Q4'09   Q1'10   Q2'10   Q3'10   Q4'10   Q1'11   Q2'11   Q3'11

                                       Revenue, $mn            y/y%


                                                                                                      5
Revenue by Product
  (Millions)
                                                                                               $139
$140

                                                                                       $121     20%
$120

                                                                                       20%
$100                                                                           $94
                                                                                                29%
                                                                     $82      21%
 $80                                                                                    32%
                                                                     22%
                                                             $62
 $60                                                $55                       30%
                                                             25%
                                            $45     27%             34%
                                    $39
 $40                                        30%
                            $30                              31%                                51%
                   $28              32%             33%
          $23                                                                           48%
                   39%      38%             32%                               49%
 $20      47%                       37%                             44%
                   32%      30%                              44%
          26%                               38%     40%
                   29%      32%     31%
          27%
  $-
        Q1'09     Q2'09   Q3'09    Q4'09   Q1'10   Q2'10   Q3'10    Q4'10    Q1'11    Q2'11    Q3'11

                Premium Subscriptions         Marketing Solutions           Hiring Solutions


                                                                                                       6
Revenue by Geography
  (Millions)
                                                                                             $139
$140

                                                                                     $121
$120
                                                                                              33%


$100                                                                          $94     32%

                                                                      $82
 $80                                                                          31%
                                                                      29%
                                                          $62
 $60                                               $55
                                                           26%
                                           $45     27%                                        67%
                                  $39                                                 68%
 $40                                      27%
                        $30       28%                                         69%
                 $28                                                  71%
          $23           25%
                 27%                                       74%
 $20      25%                                      73%
                                  72%     73%
          75%    73%    75%

  $-
        Q1'09   Q2'09   Q3'09    Q4'09    Q1'10   Q2'10   Q3'10      Q4'10   Q1'11   Q2'11   Q3'11
                          International                         US


                                                                                                     7
Revenue by Channel
  (Millions)
                                                                                               $139
$140

                                                                                       $121
$120

                                                                                                47%
$100                                                                           $94
                                                                                        45%
                                                                    $82
 $80
                                                                                46%
                                                         $62        41%
 $60                                              $55
                                          $45             46%
                                 $39              45%
 $40
                                                                                                53%
                 $28     $30              47%                                           55%
          $23                    43%
                                                                    59%         54%
 $20             46%     50%
         50%                                      55%     54%
                                 57%      53%
         50%     54%     50%
  $-
        Q1'09   Q2'09   Q3'09   Q4'09    Q1'10   Q2'10   Q3'10     Q4'10       Q1'11   Q2'11   Q3'11

                          Online Sales                           Field Sales


                                                                                                       8
Adjusted EBITDA & Margin
 (Millions)

$30                                                                                              25%

$27                                                                              $26.3
                                                                                         $24.7
$24                                                                                              20%

$21

$18                                                              $16.3                           15%

$15                                                                      $13.3
$12                                             $11.5    $11.1                                   10%
                                         $9.1
 $9

 $6                            $5.3                                                              5%
               $4.4
                       $3.7
 $3     $1.3
 $0                                                                                              0%
       Q1'09   Q2'09   Q3'09   Q4'09    Q1'10   Q2'10    Q3'10   Q4'10   Q1'11   Q2'11   Q3'11

                                       Adjusted EBITDA             Margin%


                                                                                                       9
Net Income & Cash Flow Highlights
                                                                      Q3 2010   Q2 2011   Q3 2011


       Net Income (Loss) $mn, GAAP                                    $4.0       $4.5     $(1.6)

   Net Income (Loss) $mn, Non-GAAP                                    $6.0      $10.8      $6.6
                 EPS, GAAP
       Fully-Diluted Weighted Shares
* Excludes both net income attributable to preferred shareholders &
                                                                      $0.02     $0.04     $(0.02)
                  preferred shares in share count


              EPS, Non-GAAP
       Fully-Diluted Weighted Shares                                  $0.07     $0.10     $0.06

          Operating Cash Flow (OCF)                                   $13.6     $36.0     $46.7
             Free Cash Flow, $mn
           (OCF – Purchases of PPE)                                   ($5.6)    $12.6     $17.9
           Cash, Cash Equivalents, &
             ST Investments, $mn                                      $89.6     $372.1    $387.7

                                                                                                    10
Guidance
                                   Q4 2011    FY 2011

         Revenue, $mn              $154-158   $508-512

     Adjusted EBITDA, $mn           $19-21     $83-85

Depreciation & Amortization, $mn    $14-16     $43-45

Stock Based Compensation, $mn       $10-12     $29-31


                                                         11
Non-GAAP Reconciliations


                           12
Thank You

More Related Content

LinkedIn's Q3 Earnings Call

  • 2. Safe Harbor “Safe Harbor” statement under the Private Securities Litigation Reform Act of 1995: This press release contains forward-looking statements about our planned investments in key strategic areas, and our expected financial metrics such as revenue, adjusted EBITDA, depreciation and amortization and stock-based compensation for the fourth quarter of 2011 and the full fiscal year . The achievement or success of the matters covered by such forward-looking statements involves risks, uncertainties and assumptions. If any such risks or uncertainties materialize or if any of the assumptions prove incorrect, the company’s results could differ materially from the results expressed or implied by the forward-looking statements the company makes. The risks and uncertainties referred to above include - but are not limited to - risks associated with the company’s short operating history in a new and unproven market; engagement of its members; the price volatility of its Class A common stock; expectations regarding the company’s ability to timely and effectively scale and adapt existing technology and network infrastructure to ensure that its website is accessible at all times with short or no perceptible load times; security measures and the risk that the company’s website may be subject to attacks that degrade or deny the ability of members to access the company’s solutions; members and customers curtailing or ceasing to use the company’s solutions; the company’s core value of putting members first, which may conflict with the short-term interests of the business; privacy issues; increasing competition in the market for online professional networks; and the dual class structure of the company’s common stock. Further information on these and other factors that could affect the company’s financial results is included in filings it makes with the Securities and Exchange Commission from time to time, including the section entitled “Risk Factors” in the company’s Form 10-Q that will be filed for the quarter ended September 30, 2011. These documents are available on the SEC Filings section of the Investor Information section of the company’s website at http://investors.linkedin.com/. All information provided in this release and in the attachments is as of November 3, 2011, and LinkedIn undertakes no duty to update this information. 2
  • 3. Jeff Weiner 1st Chief Executive Officer at LinkedIn San Francisco Bay Area | Internet Send Message View Profile Steve Sordello 1st Chief Financial Officer at LinkedIn San Francisco Bay Area | Internet Send Message View Profile 3
  • 4. Key Metrics (Millions) (Millions) (Billions) 140 100 131 8 7.6 88 7.1 7.1 120 116 82 80 75 6 102 5.5 100 5.0 90 65 81 60 3.9 80 4 3.6 72 53 64 46 45 60 55 48 40 2 42 40 37 20 20 0 Q1'10 Q2'10 Q3'10 Q4'10 Q1'11 Q2'11 Q3'11 Q1'10 Q2'10 Q3'10 Q4'10 Q1'11 Q2'11 Q3'11 Q1'09 Q2'09 Q3'09 Q4'09 Q1'10 Q2'10 Q3'10 Q4'10 Q1'11 Q2'11 Q3'11 Members, mn Avg comScore Unique Visitors, mn comScore Page Views, bns 4
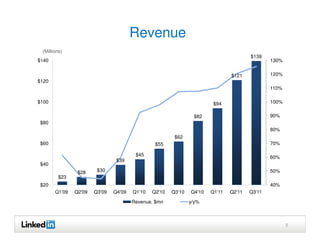
  • 5. Revenue (Millions) $139 $140 130% $121 120% $120 110% $100 $94 100% $82 90% $80 80% $62 $60 $55 70% $45 60% $39 $40 $28 $30 50% $23 $20 40% Q1'09 Q2'09 Q3'09 Q4'09 Q1'10 Q2'10 Q3'10 Q4'10 Q1'11 Q2'11 Q3'11 Revenue, $mn y/y% 5
  • 6. Revenue by Product (Millions) $139 $140 $121 20% $120 20% $100 $94 29% $82 21% $80 32% 22% $62 $60 $55 30% 25% $45 27% 34% $39 $40 30% $30 31% 51% $28 32% 33% $23 48% 39% 38% 32% 49% $20 47% 37% 44% 32% 30% 44% 26% 38% 40% 29% 32% 31% 27% $- Q1'09 Q2'09 Q3'09 Q4'09 Q1'10 Q2'10 Q3'10 Q4'10 Q1'11 Q2'11 Q3'11 Premium Subscriptions Marketing Solutions Hiring Solutions 6
  • 7. Revenue by Geography (Millions) $139 $140 $121 $120 33% $100 $94 32% $82 $80 31% 29% $62 $60 $55 26% $45 27% 67% $39 68% $40 27% $30 28% 69% $28 71% $23 25% 27% 74% $20 25% 73% 72% 73% 75% 73% 75% $- Q1'09 Q2'09 Q3'09 Q4'09 Q1'10 Q2'10 Q3'10 Q4'10 Q1'11 Q2'11 Q3'11 International US 7
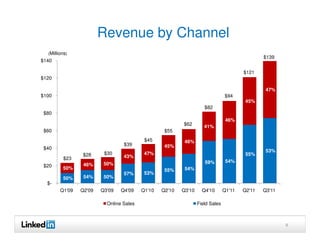
  • 8. Revenue by Channel (Millions) $139 $140 $121 $120 47% $100 $94 45% $82 $80 46% $62 41% $60 $55 $45 46% $39 45% $40 53% $28 $30 47% 55% $23 43% 59% 54% $20 46% 50% 50% 55% 54% 57% 53% 50% 54% 50% $- Q1'09 Q2'09 Q3'09 Q4'09 Q1'10 Q2'10 Q3'10 Q4'10 Q1'11 Q2'11 Q3'11 Online Sales Field Sales 8
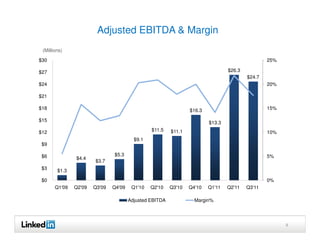
  • 9. Adjusted EBITDA & Margin (Millions) $30 25% $27 $26.3 $24.7 $24 20% $21 $18 $16.3 15% $15 $13.3 $12 $11.5 $11.1 10% $9.1 $9 $6 $5.3 5% $4.4 $3.7 $3 $1.3 $0 0% Q1'09 Q2'09 Q3'09 Q4'09 Q1'10 Q2'10 Q3'10 Q4'10 Q1'11 Q2'11 Q3'11 Adjusted EBITDA Margin% 9
  • 10. Net Income & Cash Flow Highlights Q3 2010 Q2 2011 Q3 2011 Net Income (Loss) $mn, GAAP $4.0 $4.5 $(1.6) Net Income (Loss) $mn, Non-GAAP $6.0 $10.8 $6.6 EPS, GAAP Fully-Diluted Weighted Shares * Excludes both net income attributable to preferred shareholders & $0.02 $0.04 $(0.02) preferred shares in share count EPS, Non-GAAP Fully-Diluted Weighted Shares $0.07 $0.10 $0.06 Operating Cash Flow (OCF) $13.6 $36.0 $46.7 Free Cash Flow, $mn (OCF – Purchases of PPE) ($5.6) $12.6 $17.9 Cash, Cash Equivalents, & ST Investments, $mn $89.6 $372.1 $387.7 10
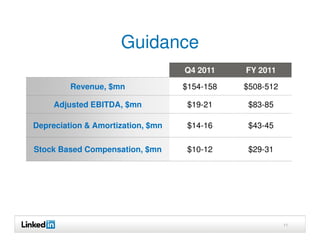
  • 11. Guidance Q4 2011 FY 2011 Revenue, $mn $154-158 $508-512 Adjusted EBITDA, $mn $19-21 $83-85 Depreciation & Amortization, $mn $14-16 $43-45 Stock Based Compensation, $mn $10-12 $29-31 11