SlideShare a Scribd company logo
Q4’12 Results


LinkedIn Confidential ©2013 All Rights Reserved
Safe Harbor
“Safe Harbor” statement under the Private Securities Litigation Reform Act of 1995: This presentation contains forward-looking
statements about our products, including our investments in products, technology and other key strategic areas, certain non-financial
metrics, such as member growth and engagement, and our expected financial metrics such as revenue, adjusted EBITDA,
depreciation and amortization and stock-based compensation for the first quarter of 2013 and the full fiscal year 2013. The
achievement of the matters covered by such forward-looking statements involves risks, uncertainties and assumptions. If any of
these risks or uncertainties materialize or if any of the assumptions prove incorrect, the company’s results could differ materially from
the results expressed or implied by the forward-looking statements the company makes.

The risks and uncertainties referred to above include - but are not limited to - risks associated with: our limited operating history in a
new and unproven market; engagement of our members; the price volatility of our Class A common stock; general economic
conditions; expectations regarding the return on our strategic investments; execution of our plans and strategies, including with
respect to mobile products and features; security measures and the risk that they may not be sufficient to secure our member data
adequately or that we are subject to attacks that degrade or deny the ability of members to access our solutions; expectations
regarding our ability to timely and effectively scale and adapt existing technology and network infrastructure to ensure that our
solutions are accessible at all times with short or no perceptible load times; our ability to maintain our rate of revenue growth and
manage our expenses and investment plans; our ability to accurately track our key metrics internally; members and customers
curtailing or ceasing to use our solutions; our core value of putting members first, which may conflict with the short-term interests of
the business; privacy and changes in regulations in the United States, Europe or elsewhere, which could impact our ability to serve
our members or curtail our monetization efforts; litigation and regulatory issues; increasing competition; our ability to manage our
growth; our ability to recruit and retain our employees; the application of US and international tax laws on our tax structure and any
changes to such tax laws; acquisitions we have made or may make in the future; and the dual class structure of our common stock.

Further information on these and other factors that could affect the company’s financial results is included in filings it makes with the
Securities and Exchange Commission from time to time, including the section entitled “Risk Factors” in the company’s Annual Report
on Form 10-K that was filed for the year ended December 31, 2011, as well as the company’s most recent Quarterly Report on Form
10-Q for the quarter ended September 30, 2012, and additional information will also be set forth in our Form 10-K that will be filed for
the year ended December 31, 2012, which should be read in conjunction with these financial results. These documents are available
on the SEC Filings section of the Investor Relations page of the company's website at http://investors.linkedin.com/. All information
provided in this release and in the attachments is as of February 7, 2013, and LinkedIn undertakes no duty to update this information.
Jeff Weiner
Chief Executive Officer
LinkedIn


Steve Sordello
Chief Financial Officer
LinkedIn


                          3
Key Metrics


*comScore metrics reflect LinkedIn site only, not including SlideShare   4
Revenue


Note: 4Q12 includes $4.4M in gross revenue   5
Revenue by Product


Note: 4Q12 includes $4.4M in gross revenue   6
Revenue by Geography


Note: 4Q12 includes $4.4M in gross revenue   7
Revenue by Channel


Note: 4Q12 includes $4.4M in gross revenue   8
Adjusted EBITDA & Margin


                           9
Net Income & Cash Flow Highlights

                                   Q4 2012   Q3 2012   Q4 2011


      Net Income $mn, GAAP         $11.5      $2.3      $6.9

    Net Income $mn, Non-GAAP       $40.2     $25.1     $13.3
             EPS, GAAP
   Fully-Diluted Weighted Shares   $0.10     $0.02     $0.06

          EPS, Non-GAAP
   Fully-Diluted Weighted Shares   $0.35     $0.22     $0.12

  Operating Cash Flow (OCF), $mn   $69.3     $87.6     $24.2

       Free Cash Flow, $mn
     (OCF – Purchases of PPE)      $37.1     $54.0      $3.5
    Cash, Cash Equivalents, &
      ST Investments, $mn          $749.5    $676.6    $577.5
Guidance


                                    Q1 2013      FY 2013


          Revenue, $mn              $305-310   $1,410-1,440


      Adjusted EBITDA, $mn           $67-69     $315-330


 Depreciation & Amortization, $mn    $25-27     $130-135


 Stock-Based Compensation, $mn       $32-34     $160-165
Non-GAAP Reconciliation
                                                  LINKEDIN CORPORATION
                                 RECONCILIATION OF GAAP TO NON-GAAP FINANCIAL MEASURES
                                              (In thousands, except per share data)
                                                          (Unaudited)

                                                          Three Months Ended                 Twelve Months Ended
                                                             December 31,                        December 31,
                                                        2012              2011              2012              2011

Non-GAAP net income and net income per share:
 GAAP net income                                    $      11,508    $        6,919     $      21,610    $       11,912
 Add back: stock-based compensation                        27,572            10,612            86,319            29,768
 Add back: amortization of intangible assets                2,943             1,155             9,872             3,635
 Income tax effect of non-GAAP adjustments                 (1,809)           (5,358)          (17,464)           (8,827)
NON-GAAP NET INCOME                                 $      40,214    $       13,328     $     100,337    $       36,488

GAAP AND NON-GAAP DILUTED SHARES                          114,095           108,612           112,844           104,118

NON-GAAP DILUTED NET INCOME PER SHARE               $        0.35    $           0.12   $        0.89    $           0.35

Adjusted EBITDA:
 Net income                                         $      11,508    $        6,919     $      21,610    $       11,912
 Provision for income taxes                                15,234             1,534            35,504            11,030
 Other (income) expense, net                                  (24)            1,575              (252)            2,903
 Depreciation and amortization                             24,297            13,784            79,849            43,100
 Stock-based compensation                                  27,572            10,612            86,319            29,768
ADJUSTED EBITDA                                     $      78,587    $       34,424     $     223,030    $       98,713


                                                                                                                            12
Thank You


LinkedIn Confidential ©2013 All Rights Reserved               13

More Related Content

LinkedIn Q4 2012 Earnings Call

  • 1. Q4’12 Results LinkedIn Confidential ©2013 All Rights Reserved
  • 2. Safe Harbor “Safe Harbor” statement under the Private Securities Litigation Reform Act of 1995: This presentation contains forward-looking statements about our products, including our investments in products, technology and other key strategic areas, certain non-financial metrics, such as member growth and engagement, and our expected financial metrics such as revenue, adjusted EBITDA, depreciation and amortization and stock-based compensation for the first quarter of 2013 and the full fiscal year 2013. The achievement of the matters covered by such forward-looking statements involves risks, uncertainties and assumptions. If any of these risks or uncertainties materialize or if any of the assumptions prove incorrect, the company’s results could differ materially from the results expressed or implied by the forward-looking statements the company makes. The risks and uncertainties referred to above include - but are not limited to - risks associated with: our limited operating history in a new and unproven market; engagement of our members; the price volatility of our Class A common stock; general economic conditions; expectations regarding the return on our strategic investments; execution of our plans and strategies, including with respect to mobile products and features; security measures and the risk that they may not be sufficient to secure our member data adequately or that we are subject to attacks that degrade or deny the ability of members to access our solutions; expectations regarding our ability to timely and effectively scale and adapt existing technology and network infrastructure to ensure that our solutions are accessible at all times with short or no perceptible load times; our ability to maintain our rate of revenue growth and manage our expenses and investment plans; our ability to accurately track our key metrics internally; members and customers curtailing or ceasing to use our solutions; our core value of putting members first, which may conflict with the short-term interests of the business; privacy and changes in regulations in the United States, Europe or elsewhere, which could impact our ability to serve our members or curtail our monetization efforts; litigation and regulatory issues; increasing competition; our ability to manage our growth; our ability to recruit and retain our employees; the application of US and international tax laws on our tax structure and any changes to such tax laws; acquisitions we have made or may make in the future; and the dual class structure of our common stock. Further information on these and other factors that could affect the company’s financial results is included in filings it makes with the Securities and Exchange Commission from time to time, including the section entitled “Risk Factors” in the company’s Annual Report on Form 10-K that was filed for the year ended December 31, 2011, as well as the company’s most recent Quarterly Report on Form 10-Q for the quarter ended September 30, 2012, and additional information will also be set forth in our Form 10-K that will be filed for the year ended December 31, 2012, which should be read in conjunction with these financial results. These documents are available on the SEC Filings section of the Investor Relations page of the company's website at http://investors.linkedin.com/. All information provided in this release and in the attachments is as of February 7, 2013, and LinkedIn undertakes no duty to update this information.
  • 3. Jeff Weiner Chief Executive Officer LinkedIn Steve Sordello Chief Financial Officer LinkedIn 3
  • 4. Key Metrics *comScore metrics reflect LinkedIn site only, not including SlideShare 4
  • 5. Revenue Note: 4Q12 includes $4.4M in gross revenue 5
  • 6. Revenue by Product Note: 4Q12 includes $4.4M in gross revenue 6
  • 7. Revenue by Geography Note: 4Q12 includes $4.4M in gross revenue 7
  • 8. Revenue by Channel Note: 4Q12 includes $4.4M in gross revenue 8
  • 9. Adjusted EBITDA & Margin 9
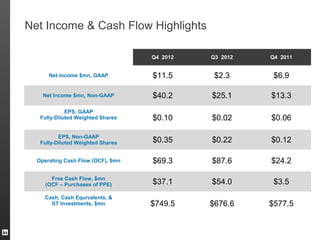
  • 10. Net Income & Cash Flow Highlights Q4 2012 Q3 2012 Q4 2011 Net Income $mn, GAAP $11.5 $2.3 $6.9 Net Income $mn, Non-GAAP $40.2 $25.1 $13.3 EPS, GAAP Fully-Diluted Weighted Shares $0.10 $0.02 $0.06 EPS, Non-GAAP Fully-Diluted Weighted Shares $0.35 $0.22 $0.12 Operating Cash Flow (OCF), $mn $69.3 $87.6 $24.2 Free Cash Flow, $mn (OCF – Purchases of PPE) $37.1 $54.0 $3.5 Cash, Cash Equivalents, & ST Investments, $mn $749.5 $676.6 $577.5
  • 11. Guidance Q1 2013 FY 2013 Revenue, $mn $305-310 $1,410-1,440 Adjusted EBITDA, $mn $67-69 $315-330 Depreciation & Amortization, $mn $25-27 $130-135 Stock-Based Compensation, $mn $32-34 $160-165
  • 12. Non-GAAP Reconciliation LINKEDIN CORPORATION RECONCILIATION OF GAAP TO NON-GAAP FINANCIAL MEASURES (In thousands, except per share data) (Unaudited) Three Months Ended Twelve Months Ended December 31, December 31, 2012 2011 2012 2011 Non-GAAP net income and net income per share: GAAP net income $ 11,508 $ 6,919 $ 21,610 $ 11,912 Add back: stock-based compensation 27,572 10,612 86,319 29,768 Add back: amortization of intangible assets 2,943 1,155 9,872 3,635 Income tax effect of non-GAAP adjustments (1,809) (5,358) (17,464) (8,827) NON-GAAP NET INCOME $ 40,214 $ 13,328 $ 100,337 $ 36,488 GAAP AND NON-GAAP DILUTED SHARES 114,095 108,612 112,844 104,118 NON-GAAP DILUTED NET INCOME PER SHARE $ 0.35 $ 0.12 $ 0.89 $ 0.35 Adjusted EBITDA: Net income $ 11,508 $ 6,919 $ 21,610 $ 11,912 Provision for income taxes 15,234 1,534 35,504 11,030 Other (income) expense, net (24) 1,575 (252) 2,903 Depreciation and amortization 24,297 13,784 79,849 43,100 Stock-based compensation 27,572 10,612 86,319 29,768 ADJUSTED EBITDA $ 78,587 $ 34,424 $ 223,030 $ 98,713 12
  • 13. Thank You LinkedIn Confidential ©2013 All Rights Reserved 13