Table of Contents
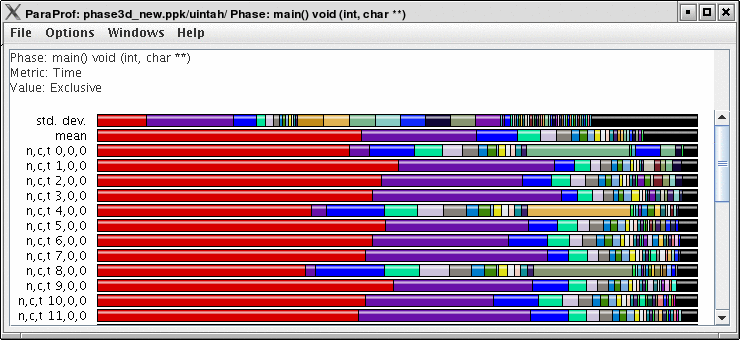
When a profile contains phase data, ParaProf will automatically run in phase mode. Most displays will show data for a particular phase. This phase will be displayed in teh top left corner in the meta data panel.
The initial window will default to top level phase, usually main
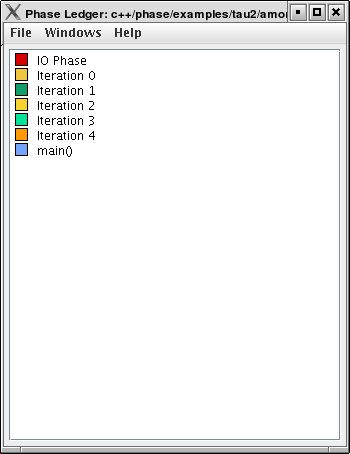
To access other phases, either right click on the phase and select, "Open Profile for this Phase", or go to the Phase Ledger and select it there.
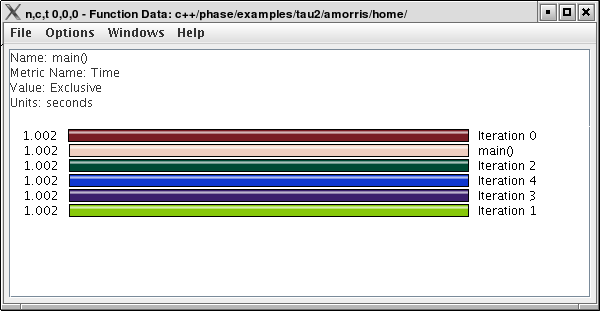
ParaProf can also display a particular function's value across all of the phases. To do so, right click on a function and select, "Show Function Data over Phases".
Because Phase information is implemented as callpaths, many of the callpath displays will show phase data as well. For example, the Call Path Text Window is useful for showing how functions behave across phases.


