| 1. | PieChart vs ColumnChart | |  |
| 2. | ColumnChart Demo | | 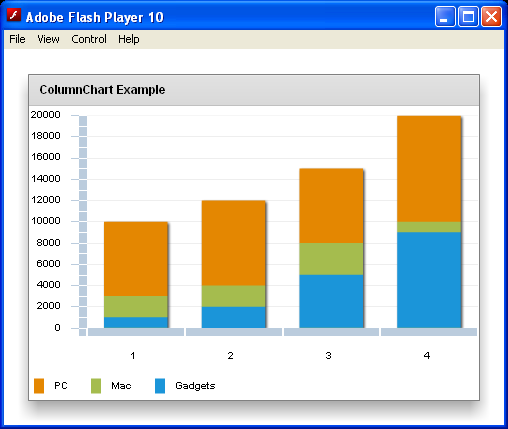 |
| 3. | Waterfall Stacked ColumnChart | |  |
| 4. | Create a PieChart control from the selected columns in the ColumnChart control. | |  |
| 5. | Column Chart Demo and CategoryAxis | | |
| 6. | Combine column chart and pie chart | |  |
| 7. | Using strokes in ActionScript | |  |
| 8. | You can also represent the range of dates in MXML by using the following syntax: | |  |
| 9. | Creating a custom Legend control | |  |
|
| 10. | Stack the Profit and Expenses fields, in which some of the values are negative. | |  |
| 11. | Add new grid lines as annotation elements to the chart and an image as the background element | |  |
| 12. | Define the grid lines inside each chart control's definition | |  |
| 13. | Turns on grid lines in both directions and applies them to the chart: | |  |
| 14. | Define set of filters, and then applies them to various chart elements: | |  |
| 15. | Mixed Chart | |  |
| 16. | Multiple Axis Chart | |  |
| 17. | Display two charts | |  |
| 18. | Define two colors and then uses those colors in the axis renderers and in the strokes and fills for the chart items | |  |
| 19. | Make Chart From Drag Drop | |  |