Company witnessed QoQ revenue decline of 38.0%, which is lowest in the last 3 years. (Source: Consolidated Financials)
Rail Vikas Nigam Share Price
Loading...
Rail Vikas Nigam Share Price
Advertisment
Rail Vikas Nigam share price insights
View All
Weekly stochastic crossover appeared on week ending Sep 13, 2024. Average price decline of -8.19% within 7 weeks of this signal in last 10 years.
Stock gave a 3 year return of 1720.66% as compared to Nifty 100 which gave a return of 47.22%. (as of last trading session)
Company has spent 2.6% of its operating revenues towards interest expenses and 0.86% towards employee cost in the year ending Mar 31, 2024. (Source: Consolidated Financials)
Rail Vikas Nigam Ltd. share price moved up by 0.60% from its previous close of Rs 552.00. Rail Vikas Nigam Ltd. stock last traded price is 555.30
Share Price Value Today/Current/Last 555.30 Previous Day 552.00
Key Metrics
PE Ratio (x) | 79.56 | ||||||||||
EPS - TTM (₹) | 6.98 | ||||||||||
MCap (₹ Cr.) | 1,15,093 | ||||||||||
Sectoral MCap Rank | 2 | ||||||||||
PB Ratio (x) | 13.16 | ||||||||||
Div Yield (%) | 0.38 | ||||||||||
Face Value (₹) | 10.00 | ||||||||||
Beta Beta
| 2.02 | ||||||||||
VWAP (₹) | 555.29 | ||||||||||
52W H/L (₹) |
Rail Vikas Nigam Share Price Returns
| 1 Day | 0.6% |
| 1 Week | -1.35% |
| 1 Month | -2.69% |
| 3 Months | 42.31% |
| 1 Year | 226.36% |
| 3 Years | 1735.7% |
| 5 Years | 2213.75% |
Rail Vikas Nigam News & Analysis
News This Vijay Kedia-backed smallcap stock surges 13% in 2 days after signing MoU with RVNL
News Chakri Lokapriya on two auto stocks to bet on for near term
News RVNL among India Inc's unlucky 13 with over 25% drop in both sales, profit in Q1
Announcement under Regulation 30 (LODR)-Newspaper Publication
Announcements
Rail Vikas Nigam Share Analysis
Unlock Stock Score, Analyst' Ratings & Recommendations

- View Stock Score on a 10-point scale
- See ratings on Earning, Fundamentals, Valuation, Risk & Price
- Check stock performance
JOIN ET PRIME
Rail Vikas Nigam Share Recommendations
Recent Recos
SELL
Current
Mean Recos by 2 Analysts
Strong
SellSellHoldBuyStrong
Buy
SellSellHoldBuyStrong
Buy
- Target₹145
- OrganizationSharekhan by BNP Paribas
- BUY
- Target₹78
- OrganizationPrabhudas Lilladher
- BUY
Analyst Trends
| Ratings | Current | 1 Week Ago | 1 Month Ago | 3 Months Ago |
|---|---|---|---|---|
| Strong Buy | - | - | - | - |
| Buy | - | - | - | - |
| Hold | 1 | 1 | 1 | 2 |
| Sell | - | - | - | - |
| Strong Sell | 1 | 1 | 1 | - |
| # Analysts | 2 | 2 | 2 | 2 |
View all
Stock Recommendations
Rail Vikas Nigam Financials
Income (P&L)
Balance Sheet
Cash Flow
Ratios
Insights
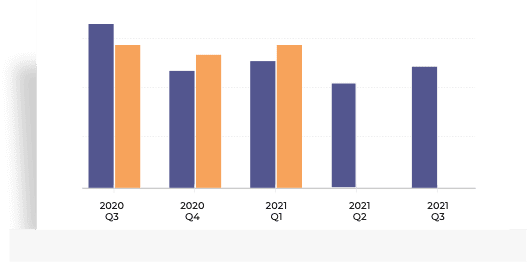
Quarterly Topline Performance
Company witnessed QoQ revenue decline of 38.0%, which is lowest in the last 3 years. (Source: Consolidated Financials)Employee & Interest Expense
Company has spent 2.6% of its operating revenues towards interest expenses and 0.86% towards employee cost in the year ending Mar 31, 2024. (Source: Consolidated Financials)
Quarterly | Annual Jun 2024 Mar 2024 Dec 2023 Sep 2023 Jun 2023 Total Income 4,336.75 6,994.31 5,016.97 5,210.34 5,853.18 Total Income Growth (%) -38.00 39.41 -3.71 -10.98 -2.05 Total Expenses 3,899.17 6,262.05 4,445.06 4,622.25 5,227.97 Total Expenses Growth (%) -37.73 40.88 -3.83 -11.59 -2.30 EBIT 437.59 732.26 571.91 588.09 625.21 EBIT Growth (%) -40.24 28.04 -2.75 -5.94 0.10 Profit after Tax (PAT) 223.93 478.58 358.57 394.26 342.90 PAT Growth (%) -53.21 33.47 -9.05 14.98 -4.55 EBIT Margin (%) 10.09 10.47 11.40 11.29 10.68 Net Profit Margin (%) 5.16 6.84 7.15 7.57 5.86 Basic EPS (₹) 1.07 2.29 1.72 1.89 1.65 All figures in Rs Cr, unless mentioned otherwise
Annual FY 2024 FY 2023 FY 2022 FY 2021 FY 2020 Total Assets 19,611.99 18,422.33 19,881.03 14,151.91 12,391.25 Total Assets Growth (%) 6.46 -7.34 40.48 14.21 2.75 Total Liabilities 10,866.14 11,097.21 13,483.63 8,585.02 7,275.35 Total Liabilities Growth (%) -2.08 -17.70 57.06 18.00 -5.08 Total Equity 8,745.85 7,325.12 6,397.40 5,566.89 5,115.90 Total Equity Growth (%) 19.40 14.50 14.92 8.82 16.39 Current Ratio (x) 2.13 2.04 2.12 3.98 3.16 Total Debt to Equity (x) 0.68 0.87 1.03 1.02 0.83 Contingent Liabilities 0.00 62,816.49 53,068.69 66,516.92 25,466.96 All figures in Rs Cr, unless mentioned otherwise
Annual FY 2024 FY 2023 FY 2022 FY 2021 FY 2020 Net Cash flow from Operating Activities 2,954.43 -4,076.26 4,800.13 657.21 -964.70 Net Cash used in Investing Activities -1,399.09 1,354.98 -1,426.35 74.69 126.17 Net Cash flow from Financing Activities -1,286.56 -1,036.02 -186.78 415.69 827.11 Net Cash Flow 267.38 -3,757.30 3,187.00 1,147.59 -11.43 Closing Cash & Cash Equivalent 1,104.05 836.67 4,608.00 1,421.40 273.81 Closing Cash & Cash Equivalent Growth (%) 31.96 -81.84 224.19 419.12 -4.01 Total Debt/ CFO (x) 2.03 -1.57 1.37 8.63 -4.41 All figures in Rs Cr, unless mentioned otherwise
Annual FY 2024 FY 2023 FY 2022 FY 2021 FY 2020 Return on Equity (%) 18.00 19.39 18.48 16.56 14.72 Return on Capital Employed (%) 16.74 15.88 15.05 10.01 10.43 Return on Assets (%) 8.02 7.71 5.94 6.51 6.07 Interest Coverage Ratio (x) 4.47 3.86 3.52 41.25 24.69 Asset Turnover Ratio (x) 1.15 1.06 1.14 108.84 117.26 Price to Earnings (x) 33.56 10.07 5.77 6.58 3.57 Price to Book (x) 6.03 1.95 1.07 1.09 0.53 EV/EBITDA (x) 21.91 8.41 3.32 8.15 5.78 EBITDA Margin (%) 11.59 11.06 10.23 7.72 7.10
Rail Vikas Nigam Share Price Forecast
PRICE
REVENUE
EARNINGS
Get multiple analysts’ prediction on Rail Vikas Nigam
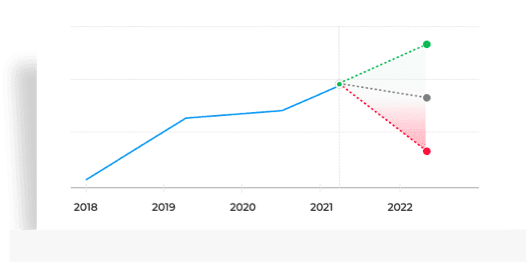
- High, low, medium predictions for Price
- Upcoming predictions for Revenue
- Details about company earnings
START FREE TRIALGet multiple analysts’ prediction on Rail Vikas Nigam
- High, low, medium predictions for Price
- Upcoming predictions for Revenue
- Details about company earnings
START FREE TRIALGet multiple analysts’ prediction on Rail Vikas Nigam
- High, low, medium predictions for Price
- Upcoming predictions for Revenue
- Details about company earnings
START FREE TRIAL
Rail Vikas Nigam Peer Comparison
Rail Vikas Nigam Stock Performance
Ratio Performance
Insights
Stock Returns vs Nifty 100
Stock gave a 3 year return of 1720.66% as compared to Nifty 100 which gave a return of 47.22%. (as of last trading session)Stock Returns vs BSE Industrials
Stock generated 1720.66% return as compared to BSE Industrials which gave investors 204.71% return over 3 year time period. (as of last trading session)
Choose from Peers
Choose from Stocks
- 1D
- 1W
- 1M
- 3M
- 6M
- 1Y
- 5Y
Loading...Insights
Stock Returns vs Nifty 100
Stock gave a 3 year return of 1720.66% as compared to Nifty 100 which gave a return of 47.22%. (as of last trading session)Stock Returns vs BSE Industrials
Stock generated 1720.66% return as compared to BSE Industrials which gave investors 204.71% return over 3 year time period. (as of last trading session)
See All Parameters
MF Ownership
MF Ownership details are not available.
Corporate Actions
Rail Vikas Nigam Board Meeting/AGM
Rail Vikas Nigam Dividends
- Others
Meeting Date Announced on Purpose Details Aug 08, 2024 Jul 29, 2024 Board Meeting Quarterly Results May 17, 2024 May 10, 2024 Board Meeting Audited Results & Final Dividend May 15, 2024 May 10, 2024 Board Meeting Audited Results & Final Dividend Feb 08, 2024 Jan 25, 2024 Board Meeting Quarterly Results Nov 09, 2023 Oct 27, 2023 Board Meeting Quarterly Results Type Dividend Dividend per Share Ex-Dividend Date Announced on Final 21% 2.11 Sep 23, 2024 May 17, 2024 Final 3% 0.36 Sep 20, 2023 May 29, 2023 Interim 17% 1.77 Apr 06, 2023 Mar 21, 2023 Final 2% 0.25 Sep 22, 2022 May 30, 2022 Interim 15% 1.58 Mar 24, 2022 Mar 09, 2022 No other corporate actions details are available.
About Rail Vikas Nigam
Rail Vikas Nigam Ltd., incorporated in the year 2003, is a Mid Cap company (having a market cap of Rs 115,781.17 Crore) operating in Construction sector. Rail Vikas Nigam Ltd. key Products/Revenue Segments include Income From Construction Work and Consultancy Income for the year ending 31-Mar-2023. Show More
Executives
Auditors
- PG
Pradeep Gaur
Chairman & Managing DirectorSKSanjeeb Kumar
Director - Finance & CFOAKAnil Kumar Khandelwal
Government Nominee DirectorDSDhananjaya Singh
Government Nominee DirectorShow More - V K Dhingra & Co.Raj Har Gopal & Co.
Industry
Key Indices Listed on
Nifty Midcap 100, Nifty 200, Nifty 500, + 22 more
Address
1st Floor,August Kranti Bhawan,New Delhi, Delhi - 110066
More Details
FAQs about Rail Vikas Nigam share
- 1. What is Rail Vikas Nigam share price and what are the returns for Rail Vikas Nigam share?Rail Vikas Nigam share price was Rs 555.30 as on 13 Sep, 2024, 04:02 PM IST. Rail Vikas Nigam share price was up by 0.60% based on previous share price of Rs. 552.0. In last 1 Month, Rail Vikas Nigam share price moved down by 2.69%.
- 2. What is the market cap of Rail Vikas Nigam?Market Capitalization of Rail Vikas Nigam stock is Rs 1,15,093 Cr.
- 3. Who's the owner of Rail Vikas Nigam?Following are the key changes to Rail Vikas Nigam shareholding:
- Promoter holding has not changed in last 9 months and holds 72.84 stake as on 30 Jun 2024
- Domestic Institutional Investors holding has gone up from 5.83 (30 Sep 2023) to 6.77 (30 Jun 2024)
- Foreign Institutional Investors holding has gone up from 2.32 (30 Sep 2023) to 3.13 (30 Jun 2024)
- Other investor holding have gone down from 19.01 (30 Sep 2023) to 17.26 (30 Jun 2024)
- 4. What are the Rail Vikas Nigam quarterly results?On Consoldiated basis, Rail Vikas Nigam reported a total income and loss of Rs 4336.75 Cr and Rs 223.93 respectively for quarter ending 2024-06-30. Total Income and profit for the year ending 2024-03-31 was Rs 23074.80 Cr and Rs 1574.30 Cr.
- 5. What are the returns for Rail Vikas Nigam share?Return Performance of Rail Vikas Nigam Shares:
- 1 Week: Rail Vikas Nigam share price moved down by 1.35%
- 1 Month: Rail Vikas Nigam share price moved down by 2.69%
- 3 Month: Rail Vikas Nigam share price moved up by 42.31%
- 6 Month: Rail Vikas Nigam share price moved up by 126.15%
- 6. What is Rail Vikas Nigam's 52 week high / low?Rail Vikas Nigam share price saw a 52 week high of Rs 647.00 and 52 week low of Rs 142.15.
- 7. How can I quickly analyze Rail Vikas Nigam stock?Key Metrics for Rail Vikas Nigam are:
- PE Ratio of Rail Vikas Nigam is 79.56
- Price/Sales ratio of Rail Vikas Nigam is 2.41
- Price to Book ratio of Rail Vikas Nigam is 13.16
- 8. What is the CAGR of Rail Vikas Nigam?The CAGR of Rail Vikas Nigam is 9.18.
- 9. What dividend is Rail Vikas Nigam giving?Rail Vikas Nigam Ltd. announced an equity dividend of 21% on a face value of 10.0 amounting to Rs 2.11 per share on 17 May 2024. The ex dividend date is 23 Sep 2024.
- 10. Who are peers to compare Rail Vikas Nigam share price?Within Construction sector Rail Vikas Nigam, NBCC (India) Ltd., NCC Ltd., G R Infraprojects Ltd., ITD Cementation India Ltd., Dilip Buildcon Ltd., Ahluwalia Contracts (India) Ltd., Hindustan Construction Company Ltd., Man Infraconstruction Ltd., Patel Engineering Ltd. and Ramky Infrastructure Ltd. are usually compared together by investors for analysis.
- 11. Who is the chairman of Rail Vikas Nigam?Pradeep Gaur is the Chairman & Managing Director of Rail Vikas Nigam
- 12. What is the PE & PB ratio of Rail Vikas Nigam?The PE ratio of Rail Vikas Nigam stands at 79.56, while the PB ratio is 13.24.
Trending in Markets
Rail Vikas Nigam Quick Links
Equity Quick Links
More from Markets
IPOStock market news
Budget 2022 Live Updates
Cryptocurrency
Currency converter
NSE holiday list
DATA SOURCES: TickerPlant (for live BSE/NSE quotes service) and Dion Global Solutions Ltd. (for corporate data, historical price & volume, F&O data). Sensex & BSE Quotes and Nifty & NSE Quotes are real-time and licensed from BSE and NSE respectively. All timestamps are reflected in IST (Indian Standard Time).
DISCLAIMER: Any and all content on this website including tools/analysis is provided to you only for convenience and on an “as-is, as- available” basis without representation and warranties of any kind. The content and any output of such tools/analysis is for informational purposes only and should not be relied upon or construed as an investment advice or guarantee for any specific performance/returns advice or considered as recommendation for the purchase or sale of any security or investment. You are advised to exercise caution, discretion and independent judgment with regards to the same and seek advice from professionals and certified experts before taking any decisions.
By using this site, you agree to the Terms of Service and Privacy Policy.