SPECpower_ssj2008
Aggregate Performance Report
Copyright © 2007-2024 Standard Performance Evaluation Corporation
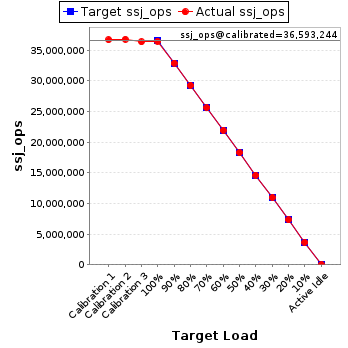
| Lenovo Global Technology ThinkSystem SD530 V3 | ssj_ops@100% = 36,484,655 ssj_ops@100% per Host = 9,121,164 ssj_ops@100% per JVM = 142,518 |
||||
| Test Sponsor: | Lenovo Global Technology | SPEC License #: | 9017 | Test Method: | Multi Node |
| Tested By: | Lenovo Global Technology | Test Location: | Beijing, China | Test Date: | May 6, 2024 |
| Hardware Availability: | Apr-2024 | Software Availability: | Jan-2024 | Publication: | May 30, 2024 |
| System Source: | Single Supplier | System Designation: | Server | Power Provisioning: | Line-powered |
| Target Load | Actual Load | ssj_ops | |
|---|---|---|---|
| Target | Actual | ||
| Calibration 1 | 36,716,441 | ||
| Calibration 2 | 36,817,108 | ||
| Calibration 3 | 36,369,379 | ||
| ssj_ops@calibrated=36,593,244 | |||
| 100% | 99.7% | 36,593,244 | 36,484,655 |
| 90% | 90.0% | 32,933,919 | 32,922,184 |
| 80% | 80.0% | 29,274,595 | 29,285,462 |
| 70% | 70.0% | 25,615,271 | 25,608,311 |
| 60% | 60.0% | 21,955,946 | 21,960,121 |
| 50% | 50.0% | 18,296,622 | 18,294,158 |
| 40% | 40.0% | 14,637,297 | 14,627,577 |
| 30% | 30.0% | 10,977,973 | 10,974,657 |
| 20% | 20.0% | 7,318,649 | 7,315,439 |
| 10% | 10.0% | 3,659,324 | 3,658,802 |
| Active Idle | 0 | 0 | |

| # of Nodes | # of Chips | # of Cores | # of Threads | Total RAM (GB) | # of OS Images | # of JVM Instances |
|---|---|---|---|---|---|---|
| 4 | 4 | 256 | 512 | 1,024 | 4 | 256 |
| Set Identifier: | sut |
| Set Description: | System Under Test |
| # of Identical Nodes: | 4 |
| Comment: | 'SUT' |
| Hardware per Node | |
|---|---|
| Hardware Vendor: | Lenovo Global Technology |
| Model: | ThinkSystem SD530 V3 |
| Form Factor: | 1U |
| CPU Name: | Intel Xeon Platinum 8592+ |
| CPU Characteristics: | 64 Core, 1.9GHz, 320MB L3 Cache |
| CPU Frequency (MHz): | 1900 |
| CPU(s) Enabled: | 64 cores, 1 chip, 64 cores/chip |
| Hardware Threads: | 128 (2 / core) |
| CPU(s) Orderable: | 1 chip |
| Primary Cache: | 32 KB I + 48 KB D on chip per core |
| Secondary Cache: | 128 MB I+D on chip per chip |
| Tertiary Cache: | 320 MB I+D on chip per chip |
| Other Cache: | None |
| Memory Amount (GB): | 256 |
| # and size of DIMM: | 8 x 32768 MB |
| Memory Details: | 32GB 2Rx8 PC5-5600; slots 1 to 8 populated |
| Power Supply Quantity and Rating (W): | None |
| Power Supply Details: | Shared |
| Disk Drive: | 1 x 960GB M.2 SSD |
| Disk Controller: | Integrated NVMe controller |
| # and type of Network Interface Cards (NICs) Installed: | 1 x ThinkSystem 1GbE RJ45 4-port |
| NICs Enabled in Firmware / OS / Connected: | 4/4/1 |
| Network Speed (Mbit): | 1000 |
| Keyboard: | None |
| Mouse: | None |
| Monitor: | None |
| Optical Drives: | No |
| Other Hardware: | None |
| Software per Node | |
|---|---|
| Power Management: | Enabled (see SUT Notes) |
| Operating System (OS): | Microsoft Windows Server 2022 Datacenter |
| OS Version: | Version 21H2 (OS Build 20348.2227) |
| Filesystem: | NTFS |
| JVM Vendor: | Oracle Corporation |
| JVM Version: | Java HotSpot(TM) 64-Bit Server VM (build 17.0.10+11-LTS-240, mixed mode, sharing), version 17.0.10 |
| JVM Command-line Options: | -server -Xmn1900m -Xms2048m -Xmx2048m -XX:ParallelGCThreads=2 -XX:+UseLargePages -XX:LargePageSizeInBytes=2m -XX:InlineSmallCode=1500 -XX:UseAVX=1 -XX:AutoBoxCacheMax=20000 -XX:+UseParallelGC -XX:+OptimizeFill -XX:+AggressiveHeap -XX:MaxInlineSize=270 -XX:FreqInlineSize=2500 |
| JVM Affinity: | start /NODE[0-1] /AFFINITY [0x3, 0xc, 0x30, 0xc0, 0x300, 0xc00, 0x3000, 0xc000, 0x30000, 0xc0000, 0x300000, 0xc00000, 0x3000000, 0xc000000, 0x30000000, 0xc0000000, 0x300000000, 0xc00000000, 0x3000000000, 0xc000000000, 0x30000000000, 0xc0000000000, 0x300000000000, 0xc00000000000, 0x3000000000000, 0xc000000000000, 0x30000000000000, 0xc0000000000000, 0x300000000000000, 0xc00000000000000, 0x3000000000000000, 0xc000000000000000] |
| JVM Instances: | 64 |
| JVM Initial Heap (MB): | 2048 |
| JVM Maximum Heap (MB): | 2048 |
| JVM Address Bits: | 64 |
| Boot Firmware Version: | FNE114H |
| Management Firmware Version: | USX336I |
| Workload Version: | SSJ 1.2.10 |
| Director Location: | Controller |
| Other Software: | KB5034129 |
| Host | ssj_ops@100% |
|---|---|
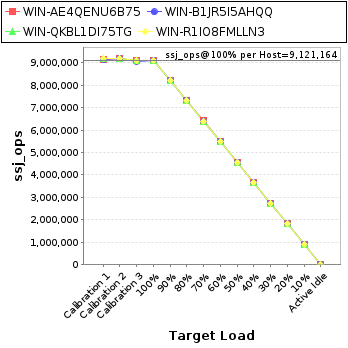
| WIN-AE4QENU6B75 | 9,124,481 |
| WIN-B1JR5I5AHQQ | 9,115,384 |
| WIN-QKBL1DI75TG | 9,123,395 |
| WIN-R1IO8FMLLN3 | 9,121,395 |
| ssj_ops@100% | 36,484,655 |
| ssj_ops@100% per Host | 9,121,164 |
| ssj_ops@100% per JVM | 142,518 |

| Target Load | Actual Load | ssj_ops | |
|---|---|---|---|
| Target | Actual | ||
| Calibration 1 | 9,169,524 | ||
| Calibration 2 | 9,207,666 | ||
| Calibration 3 | 9,097,601 | ||
| ssj_ops@calibrated=9,152,633 | |||
| 100% | 99.7% | 9,152,633 | 9,124,481 |
| 90% | 90.0% | 8,237,370 | 8,236,355 |
| 80% | 80.0% | 7,322,107 | 7,319,160 |
| 70% | 70.1% | 6,406,843 | 6,413,231 |
| 60% | 60.0% | 5,491,580 | 5,490,954 |
| 50% | 50.0% | 4,576,317 | 4,579,693 |
| 40% | 40.0% | 3,661,053 | 3,658,037 |
| 30% | 30.0% | 2,745,790 | 2,745,545 |
| 20% | 20.0% | 1,830,527 | 1,828,370 |
| 10% | 10.0% | 915,263 | 913,508 |
| Active Idle | 0 | 0 | |

| Target Load | Actual Load | ssj_ops | |
|---|---|---|---|
| Target | Actual | ||
| Calibration 1 | 9,165,325 | ||
| Calibration 2 | 9,206,737 | ||
| Calibration 3 | 9,083,639 | ||
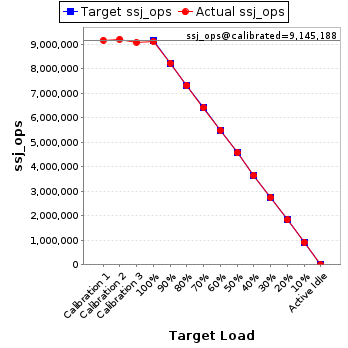
| ssj_ops@calibrated=9,145,188 | |||
| 100% | 99.7% | 9,145,188 | 9,115,384 |
| 90% | 90.0% | 8,230,669 | 8,230,492 |
| 80% | 80.1% | 7,316,150 | 7,322,445 |
| 70% | 70.0% | 6,401,632 | 6,398,509 |
| 60% | 60.1% | 5,487,113 | 5,495,059 |
| 50% | 50.0% | 4,572,594 | 4,574,259 |
| 40% | 40.0% | 3,658,075 | 3,653,787 |
| 30% | 30.0% | 2,743,556 | 2,745,290 |
| 20% | 20.0% | 1,829,038 | 1,831,094 |
| 10% | 10.0% | 914,519 | 915,839 |
| Active Idle | 0 | 0 | |

| Target Load | Actual Load | ssj_ops | |
|---|---|---|---|
| Target | Actual | ||
| Calibration 1 | 9,175,565 | ||
| Calibration 2 | 9,200,616 | ||
| Calibration 3 | 9,095,274 | ||
| ssj_ops@calibrated=9,147,945 | |||
| 100% | 99.7% | 9,147,945 | 9,123,395 |
| 90% | 89.9% | 8,233,151 | 8,221,908 |
| 80% | 80.1% | 7,318,356 | 7,323,505 |
| 70% | 69.9% | 6,403,562 | 6,394,774 |
| 60% | 60.0% | 5,488,767 | 5,491,050 |
| 50% | 50.0% | 4,573,973 | 4,571,473 |
| 40% | 40.0% | 3,659,178 | 3,656,354 |
| 30% | 29.9% | 2,744,384 | 2,738,734 |
| 20% | 20.0% | 1,829,589 | 1,828,102 |
| 10% | 10.0% | 914,795 | 914,950 |
| Active Idle | 0 | 0 | |

| Target Load | Actual Load | ssj_ops | |
|---|---|---|---|
| Target | Actual | ||
| Calibration 1 | 9,206,027 | ||
| Calibration 2 | 9,202,090 | ||
| Calibration 3 | 9,092,865 | ||
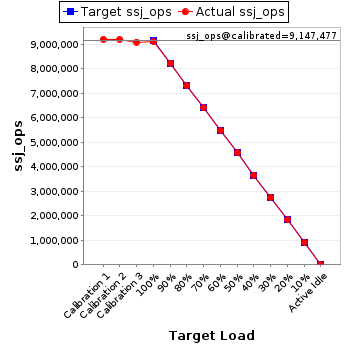
| ssj_ops@calibrated=9,147,477 | |||
| 100% | 99.7% | 9,147,477 | 9,121,395 |
| 90% | 90.0% | 8,232,729 | 8,233,429 |
| 80% | 80.0% | 7,317,982 | 7,320,351 |
| 70% | 70.0% | 6,403,234 | 6,401,797 |
| 60% | 59.9% | 5,488,486 | 5,483,058 |
| 50% | 49.9% | 4,573,739 | 4,568,733 |
| 40% | 40.0% | 3,658,991 | 3,659,398 |
| 30% | 30.0% | 2,744,243 | 2,745,088 |
| 20% | 20.0% | 1,829,495 | 1,827,873 |
| 10% | 10.0% | 914,748 | 914,506 |
| Active Idle | 0 | 0 | |
