SPECpower_ssj2008
Aggregate Performance Report
Copyright © 2007-2023 Standard Performance Evaluation Corporation
| Supermicro SuperServer SYS-F511E2-RT | ssj_ops@100% = 30,113,942 ssj_ops@100% per Host = 7,528,485 ssj_ops@100% per JVM = 134,437 |
||||
| Test Sponsor: | Supermicro | SPEC License #: | 1176 | Test Method: | Multi Node |
| Tested By: | Supermicro | Test Location: | Zhonghe Dist, New Taipei City, Taiwan (R.O.C.) | Test Date: | Jul 25, 2023 |
| Hardware Availability: | Jan-2023 | Software Availability: | Jul-2023 | Publication: | Aug 23, 2023 |
| System Source: | Single Supplier | System Designation: | Server | Power Provisioning: | Line-powered |
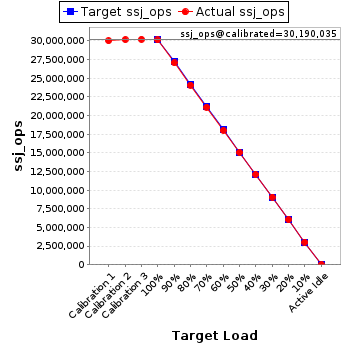
| Target Load | Actual Load | ssj_ops | |
|---|---|---|---|
| Target | Actual | ||
| Calibration 1 | 29,996,980 | ||
| Calibration 2 | 30,165,690 | ||
| Calibration 3 | 30,214,380 | ||
| ssj_ops@calibrated=30,190,035 | |||
| 100% | 99.7% | 30,190,035 | 30,113,942 |
| 90% | 89.6% | 27,171,031 | 27,049,248 |
| 80% | 79.7% | 24,152,028 | 24,070,775 |
| 70% | 69.9% | 21,133,024 | 21,115,208 |
| 60% | 59.6% | 18,114,021 | 18,004,695 |
| 50% | 49.9% | 15,095,017 | 15,061,869 |
| 40% | 40.1% | 12,076,014 | 12,091,609 |
| 30% | 30.0% | 9,057,010 | 9,065,235 |
| 20% | 20.0% | 6,038,007 | 6,035,365 |
| 10% | 10.0% | 3,019,003 | 3,021,685 |
| Active Idle | 0 | 0 | |
| # of Nodes | # of Chips | # of Cores | # of Threads | Total RAM (GB) | # of OS Images | # of JVM Instances |
|---|---|---|---|---|---|---|
| 4 | 4 | 224 | 448 | 1,024 | 4 | 224 |
| Set Identifier: | sut |
| Set Description: | System Under Test |
| # of Identical Nodes: | 4 |
| Comment: | None |
| Hardware per Node | |
|---|---|
| Hardware Vendor: | Supermicro |
| Model: | SuperServer SYS-F511E2-RT |
| Form Factor: | Blade |
| CPU Name: | Intel(R) Xeon(R) 8480+,2.00GHz |
| CPU Characteristics: | 56 Core, 2.0GHz, 105 MB cache |
| CPU Frequency (MHz): | 2000 |
| CPU(s) Enabled: | 56 cores, 1 chip, 56 cores/chip |
| Hardware Threads: | 112 (2 / core) |
| CPU(s) Orderable: | 1 chip |
| Primary Cache: | 32 KB I + 48 KB D on chip per core |
| Secondary Cache: | 2 MB I+D on chip per core |
| Tertiary Cache: | 105 MB I+D on chip per chip |
| Other Cache: | None |
| Memory Amount (GB): | 256 |
| # and size of DIMM: | 8 x 32 GB |
| Memory Details: | 32GB 2Rx4 DDR5-4800; CPU1 A1,B1,C1,D1,E1,F1,G1,H1 populated. |
| Power Supply Quantity and Rating (W): | None |
| Power Supply Details: | N/A |
| Disk Drive: | 1x480GB M.2 NVMe GEN4 Micron,MTFDKBA480TFR-1BC1ZABYY |
| Disk Controller: | onboard SCU controller |
| # and type of Network Interface Cards (NICs) Installed: | 1 x Dual Intel I350 Gigabit Ethernet controller, AOC-AG-i2M |
| NICs Enabled in Firmware / OS / Connected: | 2/2/1 |
| Network Speed (Mbit): | 1000 |
| Keyboard: | None |
| Mouse: | None |
| Monitor: | None |
| Optical Drives: | No |
| Other Hardware: | None |
| Software per Node | |
|---|---|
| Power Management: | Power Saver (see SUT Notes) |
| Operating System (OS): | Microsoft Windows Server 2022 Datacenter |
| OS Version: | Version 10.0.20348 Build 20348 |
| Filesystem: | NTFS |
| JVM Vendor: | Oracle Corporation |
| JVM Version: | Java HotSpot(TM) 64-Bit Server VM 18.9 (build 11.0.4+10-LTS, mixed mode) |
| JVM Command-line Options: | -server-Xms1995m -Xmx1995m -Xmn1825m -XX:SurvivorRatio=1 -XX:TargetSurvivorRatio=99 -XX:ParallelGCThreads=2 -XX:AllocatePrefetchDistance=256 -XX:AllocatePrefetchLines=4 -XX:LoopUnrollLimit=45 -XX:InitialTenuringThreshold=12 -XX:MaxTenuringThreshold=15 -XX:InlineSmallCode=3900 -XX:MaxInlineSize=270 -XX:FreqInlineSize=2500 -XX:+UseLargePages -XX:+UseParallelOldGC -XX:UseAVX=0 -XX:BiasedLockingStartupDelay=30000 -XX:-UseAdaptiveSizePolicy -XX:-ThreadLocalHandshakes |
| JVM Affinity: | start /NODE [0,1] /AFFINITY [0x3, 0xc, 0x30, 0xc0, 0x300, 0xc00, 0x3000, 0xc000, 0x3000, 0xc0000, 0x30000, 0xc00000, 0x300000, 0xc000000] |
| JVM Instances: | 56 |
| JVM Initial Heap (MB): | 1995 |
| JVM Maximum Heap (MB): | 1995 |
| JVM Address Bits: | 64 |
| Boot Firmware Version: | 1.1 |
| Management Firmware Version: | 01.00.31 |
| Workload Version: | SSJ 1.2.10 |
| Director Location: | Controller |
| Other Software: | KB5028171 |
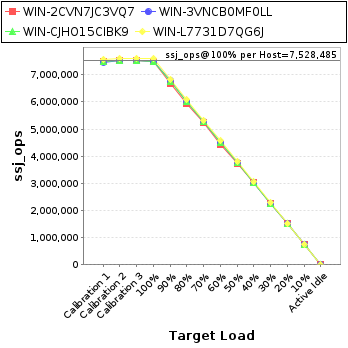
| Host | ssj_ops@100% |
|---|---|
| WIN-2CVN7JC3VQ7 | 7,509,135 |
| WIN-3VNCB0MF0LL | 7,509,273 |
| WIN-CJHO15CIBK9 | 7,506,316 |
| WIN-L7731D7QG6J | 7,589,218 |
| ssj_ops@100% | 30,113,942 |
| ssj_ops@100% per Host | 7,528,485 |
| ssj_ops@100% per JVM | 134,437 |
| Target Load | Actual Load | ssj_ops | |
|---|---|---|---|
| Target | Actual | ||
| Calibration 1 | 7,478,323 | ||
| Calibration 2 | 7,521,452 | ||
| Calibration 3 | 7,534,554 | ||
| ssj_ops@calibrated=7,528,003 | |||
| 100% | 99.7% | 7,528,003 | 7,509,135 |
| 90% | 88.6% | 6,775,203 | 6,672,994 |
| 80% | 78.9% | 6,022,403 | 5,940,276 |
| 70% | 69.7% | 5,269,602 | 5,246,894 |
| 60% | 58.7% | 4,516,802 | 4,419,939 |
| 50% | 49.4% | 3,764,002 | 3,721,479 |
| 40% | 40.0% | 3,011,201 | 3,014,111 |
| 30% | 30.0% | 2,258,401 | 2,259,392 |
| 20% | 20.0% | 1,505,601 | 1,505,683 |
| 10% | 10.0% | 752,800 | 753,834 |
| Active Idle | 0 | 0 | |
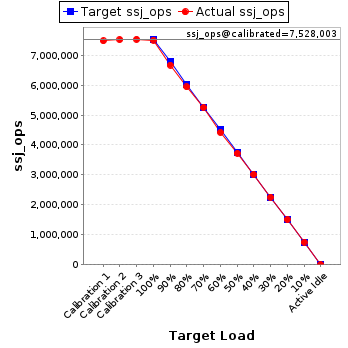
| Target Load | Actual Load | ssj_ops | |
|---|---|---|---|
| Target | Actual | ||
| Calibration 1 | 7,471,939 | ||
| Calibration 2 | 7,526,382 | ||
| Calibration 3 | 7,538,708 | ||
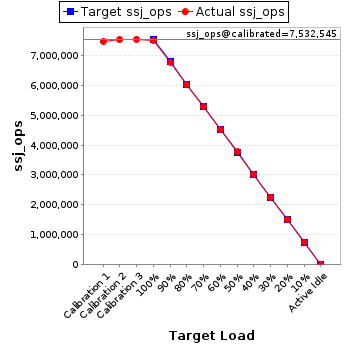
| ssj_ops@calibrated=7,532,545 | |||
| 100% | 99.7% | 7,532,545 | 7,509,273 |
| 90% | 90.0% | 6,779,291 | 6,776,026 |
| 80% | 80.0% | 6,026,036 | 6,022,850 |
| 70% | 70.0% | 5,272,782 | 5,275,896 |
| 60% | 59.9% | 4,519,527 | 4,511,213 |
| 50% | 50.1% | 3,766,273 | 3,770,294 |
| 40% | 40.0% | 3,013,018 | 3,014,700 |
| 30% | 30.0% | 2,259,764 | 2,261,868 |
| 20% | 20.0% | 1,506,509 | 1,502,912 |
| 10% | 10.1% | 753,255 | 757,030 |
| Active Idle | 0 | 0 | |
| Target Load | Actual Load | ssj_ops | |
|---|---|---|---|
| Target | Actual | ||
| Calibration 1 | 7,475,824 | ||
| Calibration 2 | 7,517,716 | ||
| Calibration 3 | 7,529,688 | ||
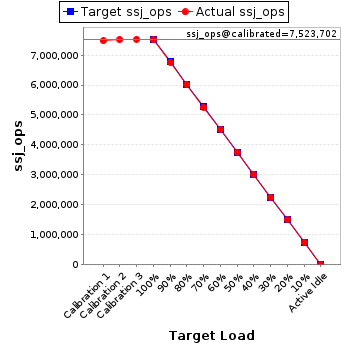
| ssj_ops@calibrated=7,523,702 | |||
| 100% | 99.8% | 7,523,702 | 7,506,316 |
| 90% | 89.9% | 6,771,332 | 6,765,870 |
| 80% | 80.0% | 6,018,962 | 6,020,912 |
| 70% | 70.0% | 5,266,592 | 5,265,467 |
| 60% | 60.0% | 4,514,221 | 4,511,384 |
| 50% | 50.0% | 3,761,851 | 3,762,192 |
| 40% | 40.1% | 3,009,481 | 3,013,723 |
| 30% | 30.0% | 2,257,111 | 2,257,999 |
| 20% | 20.0% | 1,504,740 | 1,501,982 |
| 10% | 10.0% | 752,370 | 750,980 |
| Active Idle | 0 | 0 | |
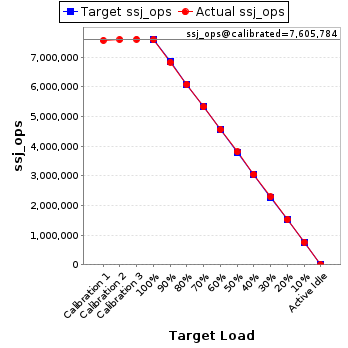
| Target Load | Actual Load | ssj_ops | |
|---|---|---|---|
| Target | Actual | ||
| Calibration 1 | 7,570,894 | ||
| Calibration 2 | 7,600,139 | ||
| Calibration 3 | 7,611,429 | ||
| ssj_ops@calibrated=7,605,784 | |||
| 100% | 99.8% | 7,605,784 | 7,589,218 |
| 90% | 89.9% | 6,845,206 | 6,834,358 |
| 80% | 80.0% | 6,084,627 | 6,086,736 |
| 70% | 70.0% | 5,324,049 | 5,326,951 |
| 60% | 60.0% | 4,563,470 | 4,562,159 |
| 50% | 50.1% | 3,802,892 | 3,807,904 |
| 40% | 40.1% | 3,042,314 | 3,049,076 |
| 30% | 30.1% | 2,281,735 | 2,285,976 |
| 20% | 20.0% | 1,521,157 | 1,524,788 |
| 10% | 10.0% | 760,578 | 759,840 |
| Active Idle | 0 | 0 | |