SPECpower_ssj2008
Aggregate Performance Report
Copyright © 2007-2022 Standard Performance Evaluation Corporation
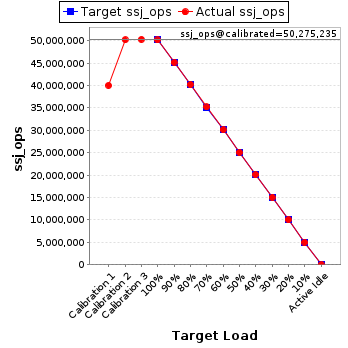
| Hewlett Packard Enterprise Synergy 480 Gen10 Plus Compute Module | ssj_ops@100% = 50,162,414 ssj_ops@100% per Host = 8,360,402 ssj_ops@100% per JVM = 104,505 |
||||
| Test Sponsor: | Hewlett Packard Enterprise | SPEC License #: | 3 | Test Method: | Multi Node |
| Tested By: | Hewlett Packard Enterprise | Test Location: | Houston, TX, USA | Test Date: | Jan 13, 2022 |
| Hardware Availability: | Apr-2021 | Software Availability: | Apr-2021 | Publication: | Feb 16, 2022 |
| System Source: | Single Supplier | System Designation: | Server | Power Provisioning: | Line-powered |
| Target Load | Actual Load | ssj_ops | |
|---|---|---|---|
| Target | Actual | ||
| Calibration 1 | 40,057,735 | ||
| Calibration 2 | 50,219,876 | ||
| Calibration 3 | 50,330,593 | ||
| ssj_ops@calibrated=50,275,235 | |||
| 100% | 99.8% | 50,275,235 | 50,162,414 |
| 90% | 89.9% | 45,247,711 | 45,213,226 |
| 80% | 80.0% | 40,220,188 | 40,227,274 |
| 70% | 70.0% | 35,192,664 | 35,202,946 |
| 60% | 60.0% | 30,165,141 | 30,152,221 |
| 50% | 50.0% | 25,137,617 | 25,116,898 |
| 40% | 40.0% | 20,110,094 | 20,093,356 |
| 30% | 30.0% | 15,082,570 | 15,071,407 |
| 20% | 20.0% | 10,055,047 | 10,049,332 |
| 10% | 10.0% | 5,027,523 | 5,030,221 |
| Active Idle | 0 | 0 | |
| # of Nodes | # of Chips | # of Cores | # of Threads | Total RAM (GB) | # of OS Images | # of JVM Instances |
|---|---|---|---|---|---|---|
| 6 | 12 | 480 | 960 | 1,536 | 6 | 480 |
| Set Identifier: | SUT |
| Set Description: | System Under Test |
| # of Identical Nodes: | 6 |
| Comment: | SUT |
| Hardware per Node | |
|---|---|
| Hardware Vendor: | Hewlett Packard Enterprise |
| Model: | Synergy 480 Gen10 Plus Compute Module |
| Form Factor: | Blade |
| CPU Name: | Intel Xeon Platinum 8380 CPU @ 2.30GHz |
| CPU Characteristics: | 40-Core, 2.30 GHz, 60MB L3 Cache |
| CPU Frequency (MHz): | 2300 |
| CPU(s) Enabled: | 80 cores, 2 chips, 40 cores/chip |
| Hardware Threads: | 160 (2 / core) |
| CPU(s) Orderable: | 1,2 chips |
| Primary Cache: | 32 KB I + 48 KB D on chip per core |
| Secondary Cache: | 1280 KB I+D on chip per core |
| Tertiary Cache: | 60 MB I+D on chip per chip |
| Other Cache: | None |
| Memory Amount (GB): | 256 |
| # and size of DIMM: | 16 x 16384 MB |
| Memory Details: | 16 x 16GB 2Rx8 PC4-3200-T; slots 1, 3, 5, 7, 10, 12, 14 & 16 on each socket |
| Power Supply Quantity and Rating (W): | None |
| Power Supply Details: | Shared |
| Disk Drive: | HPE 240GB SATA 6G Read Intensive SFF (P18420-B21) |
| Disk Controller: | Embedded SATA Controller |
| # and type of Network Interface Cards (NICs) Installed: | 1 x HPE Synergy 4820C 10/20/25Gb CNA |
| NICs Enabled in Firmware / OS / Connected: | 2/1/1 |
| Network Speed (Mbit): | 10000 |
| Keyboard: | None |
| Mouse: | None |
| Monitor: | None |
| Optical Drives: | No |
| Other Hardware: | None |
| Software per Node | |
|---|---|
| Power Management: | Enabled (see SUT Notes) |
| Operating System (OS): | SUSE Linux Enterprise Server 15 SP2 |
| OS Version: | 5.3.18-22-default |
| Filesystem: | xfs |
| JVM Vendor: | Oracle Corporation |
| JVM Version: | Oracle Java HotSpot(TM) 64-Bit Server VM 18.9 (build 11.0.11+9-LTS-194, mixed mode) |
| JVM Command-line Options: | -server -Xmn1700m -Xms1950m -Xmx1950m -XX:SurvivorRatio=1 -XX:TargetSurvivorRatio=99 -XX:ParallelGCThreads=2 -XX:AllocatePrefetchDistance=256 -XX:AllocatePrefetchLines=4 -XX:LoopUnrollLimit=45 -XX:InitialTenuringThreshold=12 -XX:MaxTenuringThreshold=15 -XX:InlineSmallCode=3900 -XX:MaxInlineSize=270 -XX:FreqInlineSize=2500 -XX:+UseLargePages -XX:+UseParallelOldGC -XX:UseAVX=0 -XX:-UseAdaptiveSizePolicy -XX:-ThreadLocalHandshakes |
| JVM Affinity: | for each physicalCore { numactl -C physicalCoreId, physicalCoreId + 80 } |
| JVM Instances: | 80 |
| JVM Initial Heap (MB): | 1950 |
| JVM Maximum Heap (MB): | 1950 |
| JVM Address Bits: | 64 |
| Boot Firmware Version: | I44 v1.40 (03/05/2021) |
| Management Firmware Version: | 2.40 pass 31 Jan 05 2021 |
| Workload Version: | SSJ 1.2.10 |
| Director Location: | Controller |
| Other Software: | None |
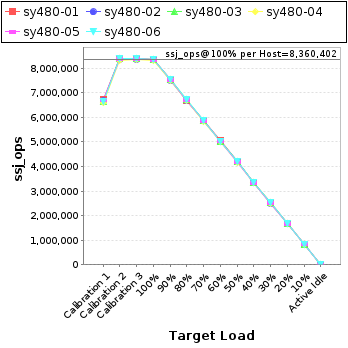
| Host | ssj_ops@100% |
|---|---|
| sy480-01 | 8,380,313 |
| sy480-02 | 8,349,631 |
| sy480-03 | 8,375,368 |
| sy480-04 | 8,321,934 |
| sy480-05 | 8,358,657 |
| sy480-06 | 8,376,510 |
| ssj_ops@100% | 50,162,414 |
| ssj_ops@100% per Host | 8,360,402 |
| ssj_ops@100% per JVM | 104,505 |
| Target Load | Actual Load | ssj_ops | |
|---|---|---|---|
| Target | Actual | ||
| Calibration 1 | 6,718,109 | ||
| Calibration 2 | 8,383,456 | ||
| Calibration 3 | 8,404,300 | ||
| ssj_ops@calibrated=8,393,878 | |||
| 100% | 99.8% | 8,393,878 | 8,380,313 |
| 90% | 89.9% | 7,554,490 | 7,547,950 |
| 80% | 79.9% | 6,715,102 | 6,708,585 |
| 70% | 70.0% | 5,875,715 | 5,874,818 |
| 60% | 60.0% | 5,036,327 | 5,040,474 |
| 50% | 50.0% | 4,196,939 | 4,193,047 |
| 40% | 39.9% | 3,357,551 | 3,352,664 |
| 30% | 30.0% | 2,518,163 | 2,514,531 |
| 20% | 20.0% | 1,678,776 | 1,679,508 |
| 10% | 10.0% | 839,388 | 836,361 |
| Active Idle | 0 | 0 | |

| Target Load | Actual Load | ssj_ops | |
|---|---|---|---|
| Target | Actual | ||
| Calibration 1 | 6,692,539 | ||
| Calibration 2 | 8,353,998 | ||
| Calibration 3 | 8,375,642 | ||
| ssj_ops@calibrated=8,364,820 | |||
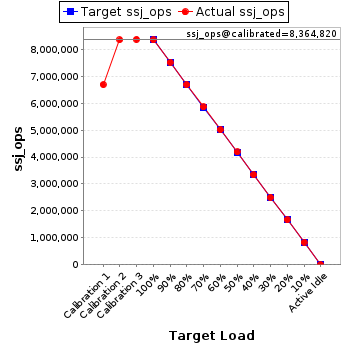
| 100% | 99.8% | 8,364,820 | 8,349,631 |
| 90% | 89.9% | 7,528,338 | 7,523,792 |
| 80% | 80.0% | 6,691,856 | 6,691,447 |
| 70% | 70.1% | 5,855,374 | 5,861,782 |
| 60% | 60.0% | 5,018,892 | 5,017,089 |
| 50% | 50.0% | 4,182,410 | 4,186,109 |
| 40% | 39.9% | 3,345,928 | 3,339,418 |
| 30% | 30.0% | 2,509,446 | 2,507,461 |
| 20% | 20.0% | 1,672,964 | 1,669,715 |
| 10% | 10.0% | 836,482 | 837,335 |
| Active Idle | 0 | 0 | |
| Target Load | Actual Load | ssj_ops | |
|---|---|---|---|
| Target | Actual | ||
| Calibration 1 | 6,665,610 | ||
| Calibration 2 | 8,390,469 | ||
| Calibration 3 | 8,402,044 | ||
| ssj_ops@calibrated=8,396,257 | |||
| 100% | 99.8% | 8,396,257 | 8,375,368 |
| 90% | 89.9% | 7,556,631 | 7,548,217 |
| 80% | 80.1% | 6,717,005 | 6,722,959 |
| 70% | 70.0% | 5,877,380 | 5,876,337 |
| 60% | 59.9% | 5,037,754 | 5,030,323 |
| 50% | 49.9% | 4,198,128 | 4,189,223 |
| 40% | 40.0% | 3,358,503 | 3,358,644 |
| 30% | 30.0% | 2,518,877 | 2,519,083 |
| 20% | 20.0% | 1,679,251 | 1,677,989 |
| 10% | 10.0% | 839,626 | 839,965 |
| Active Idle | 0 | 0 | |
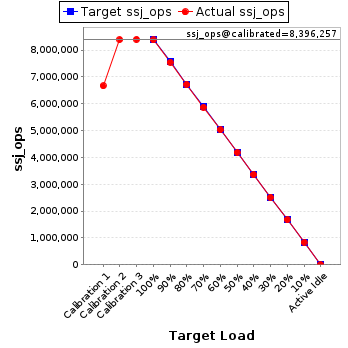
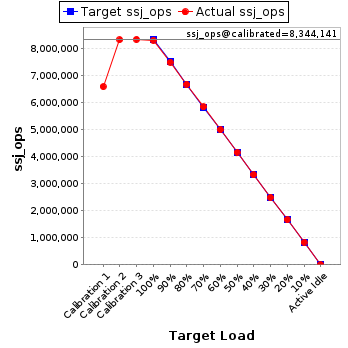
| Target Load | Actual Load | ssj_ops | |
|---|---|---|---|
| Target | Actual | ||
| Calibration 1 | 6,601,753 | ||
| Calibration 2 | 8,336,247 | ||
| Calibration 3 | 8,352,035 | ||
| ssj_ops@calibrated=8,344,141 | |||
| 100% | 99.7% | 8,344,141 | 8,321,934 |
| 90% | 90.0% | 7,509,727 | 7,506,653 |
| 80% | 80.2% | 6,675,313 | 6,688,254 |
| 70% | 70.1% | 5,840,899 | 5,848,122 |
| 60% | 60.0% | 5,006,485 | 5,004,297 |
| 50% | 50.0% | 4,172,071 | 4,168,108 |
| 40% | 39.9% | 3,337,656 | 3,332,898 |
| 30% | 30.0% | 2,503,242 | 2,500,100 |
| 20% | 20.0% | 1,668,828 | 1,670,068 |
| 10% | 10.0% | 834,414 | 835,630 |
| Active Idle | 0 | 0 | |
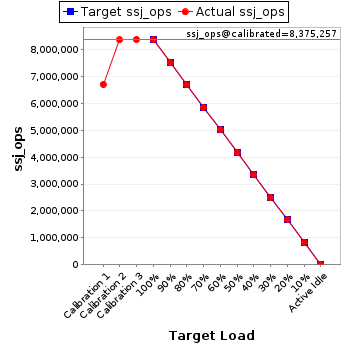
| Target Load | Actual Load | ssj_ops | |
|---|---|---|---|
| Target | Actual | ||
| Calibration 1 | 6,711,300 | ||
| Calibration 2 | 8,365,426 | ||
| Calibration 3 | 8,385,087 | ||
| ssj_ops@calibrated=8,375,257 | |||
| 100% | 99.8% | 8,375,257 | 8,358,657 |
| 90% | 89.9% | 7,537,731 | 7,531,163 |
| 80% | 80.0% | 6,700,205 | 6,697,766 |
| 70% | 70.0% | 5,862,680 | 5,859,057 |
| 60% | 60.0% | 5,025,154 | 5,028,416 |
| 50% | 49.9% | 4,187,628 | 4,181,082 |
| 40% | 39.9% | 3,350,103 | 3,344,843 |
| 30% | 30.0% | 2,512,577 | 2,511,604 |
| 20% | 20.0% | 1,675,051 | 1,673,968 |
| 10% | 10.0% | 837,526 | 840,316 |
| Active Idle | 0 | 0 | |
| Target Load | Actual Load | ssj_ops | |
|---|---|---|---|
| Target | Actual | ||
| Calibration 1 | 6,668,424 | ||
| Calibration 2 | 8,390,282 | ||
| Calibration 3 | 8,411,483 | ||
| ssj_ops@calibrated=8,400,882 | |||
| 100% | 99.7% | 8,400,882 | 8,376,510 |
| 90% | 89.9% | 7,560,794 | 7,555,451 |
| 80% | 80.0% | 6,720,706 | 6,718,262 |
| 70% | 70.0% | 5,880,618 | 5,882,829 |
| 60% | 59.9% | 5,040,529 | 5,031,624 |
| 50% | 50.0% | 4,200,441 | 4,199,330 |
| 40% | 40.1% | 3,360,353 | 3,364,890 |
| 30% | 30.0% | 2,520,265 | 2,518,628 |
| 20% | 20.0% | 1,680,176 | 1,678,083 |
| 10% | 10.0% | 840,088 | 840,614 |
| Active Idle | 0 | 0 | |
