SPECpower_ssj2008
Aggregate Performance Report
Copyright © 2007-2019 Standard Performance Evaluation Corporation
| Hewlett Packard Enterprise Synergy 480 Gen10 Compute Module | ssj_ops@100% = 28,783,614 ssj_ops@100% per Host = 5,756,723 ssj_ops@100% per JVM = 1,439,181 |
||||
| Test Sponsor: | Hewlett Packard Enterprise | SPEC License #: | 3 | Test Method: | Multi Node |
| Tested By: | Hewlett Packard Enterprise | Test Location: | Houston, TX, USA | Test Date: | Mar 27, 2019 |
| Hardware Availability: | Apr-2019 | Software Availability: | Mar-2019 | Publication: | May 8, 2019 |
| System Source: | Single Supplier | System Designation: | Server | Power Provisioning: | Line-powered |
| Target Load | Actual Load | ssj_ops | |
|---|---|---|---|
| Target | Actual | ||
| Calibration 1 | 28,888,055 | ||
| Calibration 2 | 28,862,670 | ||
| Calibration 3 | 28,879,276 | ||
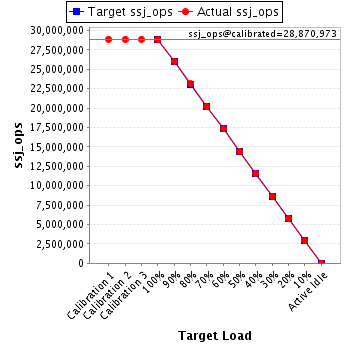
| ssj_ops@calibrated=28,870,973 | |||
| 100% | 99.7% | 28,870,973 | 28,783,614 |
| 90% | 90.0% | 25,983,876 | 25,976,099 |
| 80% | 80.0% | 23,096,778 | 23,108,881 |
| 70% | 70.0% | 20,209,681 | 20,206,778 |
| 60% | 60.0% | 17,322,584 | 17,322,007 |
| 50% | 50.0% | 14,435,487 | 14,438,321 |
| 40% | 40.0% | 11,548,389 | 11,540,187 |
| 30% | 30.0% | 8,661,292 | 8,660,068 |
| 20% | 20.0% | 5,774,195 | 5,777,358 |
| 10% | 10.0% | 2,887,097 | 2,884,365 |
| Active Idle | 0 | 0 | |
| # of Nodes | # of Chips | # of Cores | # of Threads | Total RAM (GB) | # of OS Images | # of JVM Instances |
|---|---|---|---|---|---|---|
| 5 | 10 | 280 | 560 | 960 | 5 | 20 |
| Set Identifier: | SUT |
| Set Description: | System Under Test |
| # of Identical Nodes: | 5 |
| Comment: | SUT |
| Hardware per Node | |
|---|---|
| Hardware Vendor: | Hewlett Packard Enterprise |
| Model: | Synergy 480 Gen10 Compute Module |
| Form Factor: | 7U |
| CPU Name: | Intel Xeon Platinum 8280 @ 2.70GHz (Intel Turbo Boost Technology up to 4.00 GHz) |
| CPU Characteristics: | 28-Core, 2.70 GHz, 38.5MB L3 Cache |
| CPU Frequency (MHz): | 2700 |
| CPU(s) Enabled: | 56 cores, 2 chips, 28 cores/chip |
| Hardware Threads: | 112 (2 / core) |
| CPU(s) Orderable: | 1,2 chips |
| Primary Cache: | 32 KB I + 32 KB D on chip per core |
| Secondary Cache: | 1 MB I+D on chip per core |
| Tertiary Cache: | 39424 KB I+D on chip per chip |
| Other Cache: | None |
| Memory Amount (GB): | 192 |
| # and size of DIMM: | 12 x 16384 MB |
| Memory Details: | 12 x 16GB 2Rx8 PC4-2933Y-R; slots 1, 3, 5, 8, 10 and 12 populated in each socket |
| Power Supply Quantity and Rating (W): | None |
| Power Supply Details: | N/A |
| Disk Drive: | 1 x HPE 240GB 6G SATA M.2 SSD (875488-B21) |
| Disk Controller: | HPE Smart Array S100i SR Gen10 |
| # and type of Network Interface Cards (NICs) Installed: | 1 x HPE Synergy 3820C 10/20Gb CNA |
| NICs Enabled in Firmware / OS / Connected: | 2/2/1 |
| Network Speed (Mbit): | 1000 |
| Keyboard: | None |
| Mouse: | None |
| Monitor: | None |
| Optical Drives: | No |
| Other Hardware: | H/S: Standard |
| Software per Node | |
|---|---|
| Power Management: | Enabled (see SUT Notes) |
| Operating System (OS): | Windows Server 2012 R2 Datacenter |
| OS Version: | Version 6.3 (Build 9600) |
| Filesystem: | NTFS |
| JVM Vendor: | Oracle Corporation |
| JVM Version: | Oracle Java HotSpot(TM) 64-Bit Server VM (build 24.80-b11, mixed mode), version 1.7.0_80 |
| JVM Command-line Options: | -server -Xmn21000m -Xms24000m -Xmx24000m -XX:SurvivorRatio=1 -XX:TargetSurvivorRatio=99 -XX:AllocatePrefetchDistance=256 -XX:AllocatePrefetchLines=4 -XX:LoopUnrollLimit=45 -XX:InitialTenuringThreshold=12 -XX:MaxTenuringThreshold=15 -XX:ParallelGCThreads=28 -XX:InlineSmallCode=3900 -XX:MaxInlineSize=270 -XX:FreqInlineSize=2500 -XX:+AggressiveOpts -XX:+UseLargePages -XX:+UseParallelOldGC |
| JVM Affinity: | start /NODE [0,1,2,3] /AFFINITY [0xFFFFFFF] |
| JVM Instances: | 4 |
| JVM Initial Heap (MB): | 24000 |
| JVM Maximum Heap (MB): | 24000 |
| JVM Address Bits: | 64 |
| Boot Firmware Version: | I42 v2.00 (02/02/2019) |
| Management Firmware Version: | 1.40 Feb 05 2019 |
| Workload Version: | SSJ 1.2.10 |
| Director Location: | Controller |
| Other Software: | HPE Service Pack for ProLiant (SPP) Version: 2019.03.0, Microsoft Windows KB4056898, KB4338815 |
| Host | ssj_ops@100% |
|---|---|
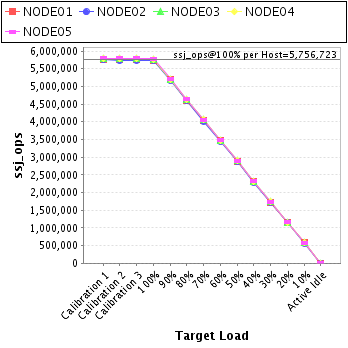
| NODE01 | 5,739,811 |
| NODE02 | 5,721,194 |
| NODE03 | 5,772,513 |
| NODE04 | 5,772,087 |
| NODE05 | 5,778,010 |
| ssj_ops@100% | 28,783,614 |
| ssj_ops@100% per Host | 5,756,723 |
| ssj_ops@100% per JVM | 1,439,181 |
| Target Load | Actual Load | ssj_ops | |
|---|---|---|---|
| Target | Actual | ||
| Calibration 1 | 5,763,382 | ||
| Calibration 2 | 5,755,880 | ||
| Calibration 3 | 5,760,089 | ||
| ssj_ops@calibrated=5,757,984 | |||
| 100% | 99.7% | 5,757,984 | 5,739,811 |
| 90% | 90.1% | 5,182,186 | 5,187,060 |
| 80% | 80.0% | 4,606,387 | 4,604,227 |
| 70% | 70.0% | 4,030,589 | 4,027,764 |
| 60% | 60.1% | 3,454,791 | 3,460,897 |
| 50% | 50.0% | 2,878,992 | 2,881,278 |
| 40% | 40.0% | 2,303,194 | 2,302,671 |
| 30% | 30.0% | 1,727,395 | 1,727,672 |
| 20% | 20.0% | 1,151,597 | 1,153,880 |
| 10% | 10.0% | 575,798 | 577,886 |
| Active Idle | 0 | 0 | |

| Target Load | Actual Load | ssj_ops | |
|---|---|---|---|
| Target | Actual | ||
| Calibration 1 | 5,747,211 | ||
| Calibration 2 | 5,734,091 | ||
| Calibration 3 | 5,740,894 | ||
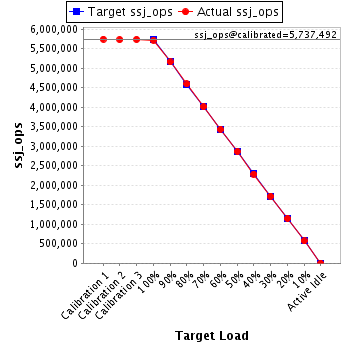
| ssj_ops@calibrated=5,737,492 | |||
| 100% | 99.7% | 5,737,492 | 5,721,194 |
| 90% | 90.0% | 5,163,743 | 5,162,835 |
| 80% | 80.1% | 4,589,994 | 4,597,866 |
| 70% | 70.0% | 4,016,245 | 4,013,380 |
| 60% | 59.9% | 3,442,495 | 3,439,045 |
| 50% | 50.0% | 2,868,746 | 2,867,781 |
| 40% | 39.9% | 2,294,997 | 2,288,516 |
| 30% | 30.0% | 1,721,248 | 1,723,177 |
| 20% | 20.0% | 1,147,498 | 1,149,361 |
| 10% | 10.0% | 573,749 | 571,898 |
| Active Idle | 0 | 0 | |
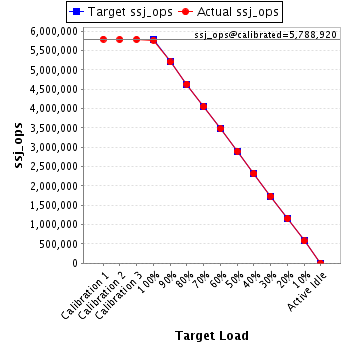
| Target Load | Actual Load | ssj_ops | |
|---|---|---|---|
| Target | Actual | ||
| Calibration 1 | 5,796,164 | ||
| Calibration 2 | 5,788,192 | ||
| Calibration 3 | 5,789,648 | ||
| ssj_ops@calibrated=5,788,920 | |||
| 100% | 99.7% | 5,788,920 | 5,772,513 |
| 90% | 89.9% | 5,210,028 | 5,205,946 |
| 80% | 80.1% | 4,631,136 | 4,634,186 |
| 70% | 70.0% | 4,052,244 | 4,054,191 |
| 60% | 60.1% | 3,473,352 | 3,477,914 |
| 50% | 50.0% | 2,894,460 | 2,896,998 |
| 40% | 40.0% | 2,315,568 | 2,316,135 |
| 30% | 30.0% | 1,736,676 | 1,738,219 |
| 20% | 20.0% | 1,157,784 | 1,156,250 |
| 10% | 10.0% | 578,892 | 576,612 |
| Active Idle | 0 | 0 | |
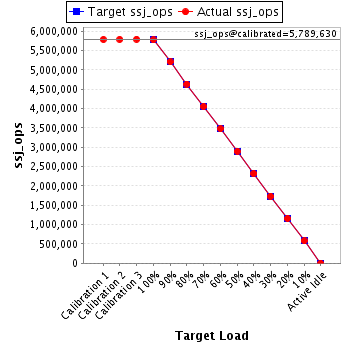
| Target Load | Actual Load | ssj_ops | |
|---|---|---|---|
| Target | Actual | ||
| Calibration 1 | 5,784,563 | ||
| Calibration 2 | 5,786,435 | ||
| Calibration 3 | 5,792,825 | ||
| ssj_ops@calibrated=5,789,630 | |||
| 100% | 99.7% | 5,789,630 | 5,772,087 |
| 90% | 89.9% | 5,210,667 | 5,204,864 |
| 80% | 80.0% | 4,631,704 | 4,632,629 |
| 70% | 70.0% | 4,052,741 | 4,054,729 |
| 60% | 60.0% | 3,473,778 | 3,472,476 |
| 50% | 50.0% | 2,894,815 | 2,896,015 |
| 40% | 40.0% | 2,315,852 | 2,315,042 |
| 30% | 30.0% | 1,736,889 | 1,735,502 |
| 20% | 20.0% | 1,157,926 | 1,157,605 |
| 10% | 10.0% | 578,963 | 578,927 |
| Active Idle | 0 | 0 | |
| Target Load | Actual Load | ssj_ops | |
|---|---|---|---|
| Target | Actual | ||
| Calibration 1 | 5,796,734 | ||
| Calibration 2 | 5,798,073 | ||
| Calibration 3 | 5,795,821 | ||
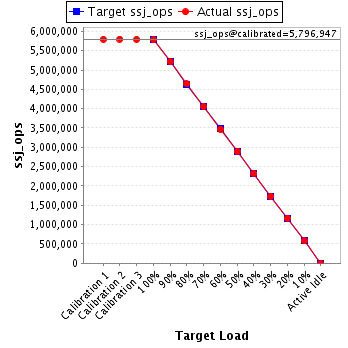
| ssj_ops@calibrated=5,796,947 | |||
| 100% | 99.7% | 5,796,947 | 5,778,010 |
| 90% | 90.0% | 5,217,252 | 5,215,394 |
| 80% | 80.0% | 4,637,558 | 4,639,974 |
| 70% | 70.0% | 4,057,863 | 4,056,714 |
| 60% | 59.9% | 3,478,168 | 3,471,676 |
| 50% | 50.0% | 2,898,473 | 2,896,250 |
| 40% | 40.0% | 2,318,779 | 2,317,823 |
| 30% | 29.9% | 1,739,084 | 1,735,498 |
| 20% | 20.0% | 1,159,389 | 1,160,262 |
| 10% | 10.0% | 579,695 | 579,042 |
| Active Idle | 0 | 0 | |