SPECpower_ssj2008
Host 'T6000-1' Performance Report
Copyright © 2007-2011 Standard Performance Evaluation Corporation
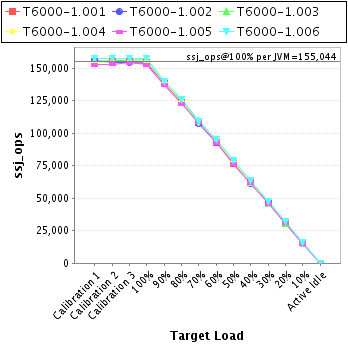
| Huawei Technologies Co., Ltd XH620 | ssj_ops@100% = 930,267 ssj_ops@100% per JVM = 155,044 |
||||
| Test Sponsor: | Huawei Technologies Co., Ltd | SPEC License #: | 3175 | Test Method: | Multi Node |
| Tested By: | Huawei Technologies Co., Ltd | Test Location: | Shenzhen, Guangdong, China | Test Date: | Jun 2, 2011 |
| Hardware Availability: | Dec-2010 | Software Availability: | Dec-2010 | Publication: | Jul 13, 2011 |
| System Source: | Single Supplier | System Designation: | Server | Power Provisioning: | Line-powered |
| Target Load | Actual Load | ssj_ops | |
|---|---|---|---|
| Target | Actual | ||
| Calibration 1 | 930,932 | ||
| Calibration 2 | 931,142 | ||
| Calibration 3 | 932,746 | ||
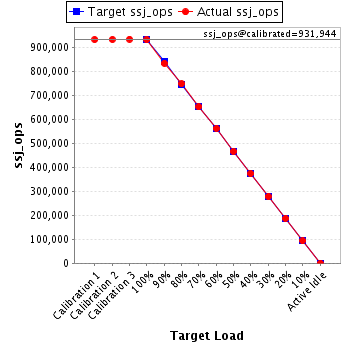
| ssj_ops@calibrated=931,944 | |||
| 100% | 99.8% | 931,944 | 930,267 |
| 90% | 89.3% | 838,749 | 832,436 |
| 80% | 80.1% | 745,555 | 746,736 |
| 70% | 69.8% | 652,361 | 650,733 |
| 60% | 60.2% | 559,166 | 561,296 |
| 50% | 50.0% | 465,972 | 466,360 |
| 40% | 40.0% | 372,778 | 372,860 |
| 30% | 29.8% | 279,583 | 277,823 |
| 20% | 20.1% | 186,389 | 187,065 |
| 10% | 10.0% | 93,194 | 93,093 |
| Active Idle | 0 | 0 | |
| Set Identifier: | sut |
| Set Description: | System Under Test |
| # of Identical Nodes: | 2 |
| Comment: | None |
| Hardware | |
|---|---|
| Hardware Vendor: | Huawei Technologies Co., Ltd |
| Model: | XH620 |
| Form Factor: | 1U |
| CPU Name: | Intel Xeon X5675 |
| CPU Characteristics: | Six-Core, 3.06GHz, 12MB L3 Cache |
| CPU Frequency (MHz): | 3067 |
| CPU(s) Enabled: | 12 cores, 2 chips, 6 cores/chip |
| Hardware Threads: | 24 (2 / core) |
| CPU(s) Orderable: | 2 chips |
| Primary Cache: | 32 KB I + 32 KB D on chip per core |
| Secondary Cache: | 256 KB I+D on chip per core |
| Tertiary Cache: | 12 MB I+D on chip per chip |
| Other Cache: | None |
| Memory Amount (GB): | 16 |
| # and size of DIMM: | 4 x 4 GB |
| Memory Details: | 2GB 2Rx8 PC3L-10600E ECC |
| Power Supply Quantity and Rating (W): | None |
| Power Supply Details: | Shared |
| Disk Drive: | 1 x 160GB SSD 2.5" SATA SA:E64511-309 |
| Disk Controller: | Integrated SATA controller |
| # and type of Network Interface Cards (NICs) Installed: | 1 x Dual-port BCM 5709 Gigabit Ethernet controller |
| NICs Enabled in Firmware / OS / Connected: | 2/2/1 |
| Network Speed (Mbit): | 1000 |
| Keyboard: | None |
| Mouse: | None |
| Monitor: | None |
| Optical Drives: | No |
| Other Hardware: | None |
| Software | |
|---|---|
| Power Management: | Power Saver enabled in OS |
| Operating System (OS): | Windows Server 2008 R2, Enterprise Edition |
| OS Version: | R2 |
| Filesystem: | NTFS |
| JVM Vendor: | IBM Corporation |
| JVM Version: | IBM J9 VM (build 2.4, JRE 1.6.0 IBM J9 2.4 Windows Server 2008 amd64-64 jvmwa6460sr6-20090923_42924 (JIT enabled, AOT enabled) |
| JVM Command-line Options: | -Xaggressive -Xcompressedrefs -Xgcpolicy:gencon -Xmn1625m -Xms1875m -Xmx1875m -XlockReservation -Xnoloa -XtlhPrefetch -Xlp |
| JVM Affinity: | start /affinity [0xF,0xF0,0xF00,0xF000,0xF0000,0xF00000] |
| JVM Instances: | 6 |
| JVM Initial Heap (MB): | 1875 |
| JVM Maximum Heap (MB): | 1875 |
| JVM Address Bits: | 64 |
| Boot Firmware Version: | SAV18 |
| Management Firmware Version: | V018 |
| Workload Version: | SSJ 1.2.6 |
| Director Location: | Controller |
| Other Software: | IBM Websphere application server V7.0 for Windows on X86-64bit |
| JVM Instance | ssj_ops@100% |
|---|---|
| T6000-1.001 | 154,590 |
| T6000-1.002 | 153,563 |
| T6000-1.003 | 156,654 |
| T6000-1.004 | 155,488 |
| T6000-1.005 | 152,657 |
| T6000-1.006 | 157,316 |
| ssj_ops@100% | 930,267 |
| ssj_ops@100% per JVM | 155,044 |
| Target Load | Actual Load | ssj_ops | |
|---|---|---|---|
| Target | Actual | ||
| Calibration 1 | 155,120 | ||
| Calibration 2 | 155,236 | ||
| Calibration 3 | 154,842 | ||
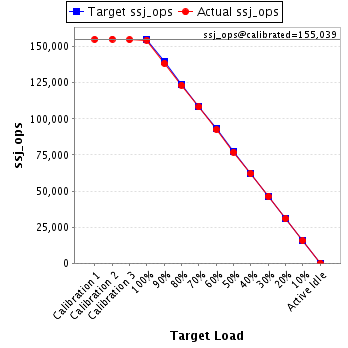
| ssj_ops@calibrated=155,039 | |||
| 100% | 99.7% | 155,039 | 154,590 |
| 90% | 89.3% | 139,535 | 138,428 |
| 80% | 79.6% | 124,031 | 123,356 |
| 70% | 69.8% | 108,527 | 108,264 |
| 60% | 59.8% | 93,023 | 92,660 |
| 50% | 49.7% | 77,519 | 77,003 |
| 40% | 40.0% | 62,016 | 62,040 |
| 30% | 29.9% | 46,512 | 46,302 |
| 20% | 19.9% | 31,008 | 30,800 |
| 10% | 10.1% | 15,504 | 15,666 |
| Active Idle | 0 | 0 | |
| Target Load | Actual Load | ssj_ops | |
|---|---|---|---|
| Target | Actual | ||
| Calibration 1 | 155,614 | ||
| Calibration 2 | 154,545 | ||
| Calibration 3 | 154,406 | ||
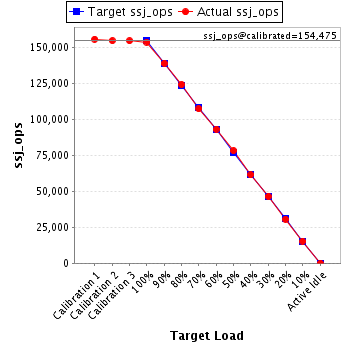
| ssj_ops@calibrated=154,475 | |||
| 100% | 99.4% | 154,475 | 153,563 |
| 90% | 89.8% | 139,028 | 138,764 |
| 80% | 80.3% | 123,580 | 124,113 |
| 70% | 69.4% | 108,133 | 107,253 |
| 60% | 60.3% | 92,685 | 93,150 |
| 50% | 50.6% | 77,238 | 78,103 |
| 40% | 39.7% | 61,790 | 61,320 |
| 30% | 30.0% | 46,343 | 46,416 |
| 20% | 19.8% | 30,895 | 30,662 |
| 10% | 10.0% | 15,448 | 15,371 |
| Active Idle | 0 | 0 | |
| Target Load | Actual Load | ssj_ops | |
|---|---|---|---|
| Target | Actual | ||
| Calibration 1 | 155,114 | ||
| Calibration 2 | 156,047 | ||
| Calibration 3 | 155,947 | ||
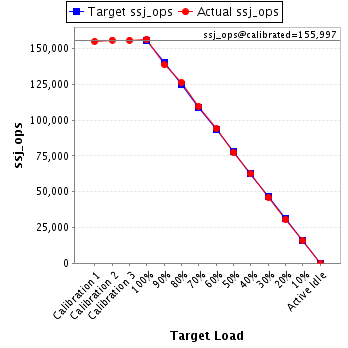
| ssj_ops@calibrated=155,997 | |||
| 100% | 100.4% | 155,997 | 156,654 |
| 90% | 88.9% | 140,397 | 138,759 |
| 80% | 80.9% | 124,797 | 126,236 |
| 70% | 70.3% | 109,198 | 109,601 |
| 60% | 60.4% | 93,598 | 94,201 |
| 50% | 49.8% | 77,998 | 77,617 |
| 40% | 40.0% | 62,399 | 62,431 |
| 30% | 29.5% | 46,799 | 46,052 |
| 20% | 19.8% | 31,199 | 30,879 |
| 10% | 10.2% | 15,600 | 15,950 |
| Active Idle | 0 | 0 | |
| Target Load | Actual Load | ssj_ops | |
|---|---|---|---|
| Target | Actual | ||
| Calibration 1 | 154,680 | ||
| Calibration 2 | 155,253 | ||
| Calibration 3 | 155,497 | ||
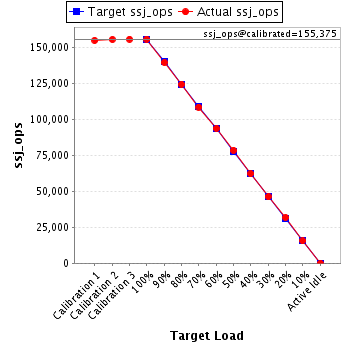
| ssj_ops@calibrated=155,375 | |||
| 100% | 100.1% | 155,375 | 155,488 |
| 90% | 89.7% | 139,838 | 139,328 |
| 80% | 80.0% | 124,300 | 124,251 |
| 70% | 69.8% | 108,763 | 108,422 |
| 60% | 60.2% | 93,225 | 93,607 |
| 50% | 50.5% | 77,688 | 78,449 |
| 40% | 40.0% | 62,150 | 62,087 |
| 30% | 29.7% | 46,613 | 46,153 |
| 20% | 20.5% | 31,075 | 31,787 |
| 10% | 10.0% | 15,538 | 15,495 |
| Active Idle | 0 | 0 | |
| Target Load | Actual Load | ssj_ops | |
|---|---|---|---|
| Target | Actual | ||
| Calibration 1 | 152,847 | ||
| Calibration 2 | 152,938 | ||
| Calibration 3 | 154,323 | ||
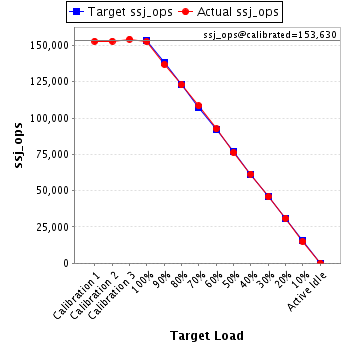
| ssj_ops@calibrated=153,630 | |||
| 100% | 99.4% | 153,630 | 152,657 |
| 90% | 89.2% | 138,267 | 136,979 |
| 80% | 79.9% | 122,904 | 122,811 |
| 70% | 70.6% | 107,541 | 108,409 |
| 60% | 60.2% | 92,178 | 92,529 |
| 50% | 49.6% | 76,815 | 76,269 |
| 40% | 40.0% | 61,452 | 61,452 |
| 30% | 29.8% | 46,089 | 45,766 |
| 20% | 20.2% | 30,726 | 30,958 |
| 10% | 9.8% | 15,363 | 14,983 |
| Active Idle | 0 | 0 | |
| Target Load | Actual Load | ssj_ops | |
|---|---|---|---|
| Target | Actual | ||
| Calibration 1 | 157,557 | ||
| Calibration 2 | 157,123 | ||
| Calibration 3 | 157,732 | ||
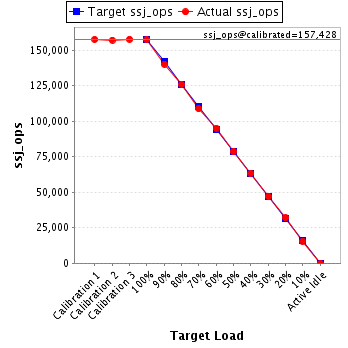
| ssj_ops@calibrated=157,428 | |||
| 100% | 99.9% | 157,428 | 157,316 |
| 90% | 89.0% | 141,685 | 140,179 |
| 80% | 80.0% | 125,942 | 125,969 |
| 70% | 69.1% | 110,199 | 108,784 |
| 60% | 60.4% | 94,457 | 95,149 |
| 50% | 50.1% | 78,714 | 78,920 |
| 40% | 40.4% | 62,971 | 63,531 |
| 30% | 29.9% | 47,228 | 47,134 |
| 20% | 20.3% | 31,486 | 31,979 |
| 10% | 9.9% | 15,743 | 15,629 |
| Active Idle | 0 | 0 | |