Uintah/AMR
Contents
Basic Information
| Machine | Inferno (128 node 2.6 GHz Xeon cluster) |
| Input File | hotBlob_AMRb.ups |
| Run size | 64 CPUs |
| Run time | about 35 minutes (2100 seconds) |
| Date | March 2007 |
Callpath Results
TAU was configured with:
-mpiinc=/usr/local/lam-mpi/include/ -mpilib=/usr/local/lam-mpi/lib -PROFILECALLPATH -useropt=-O3
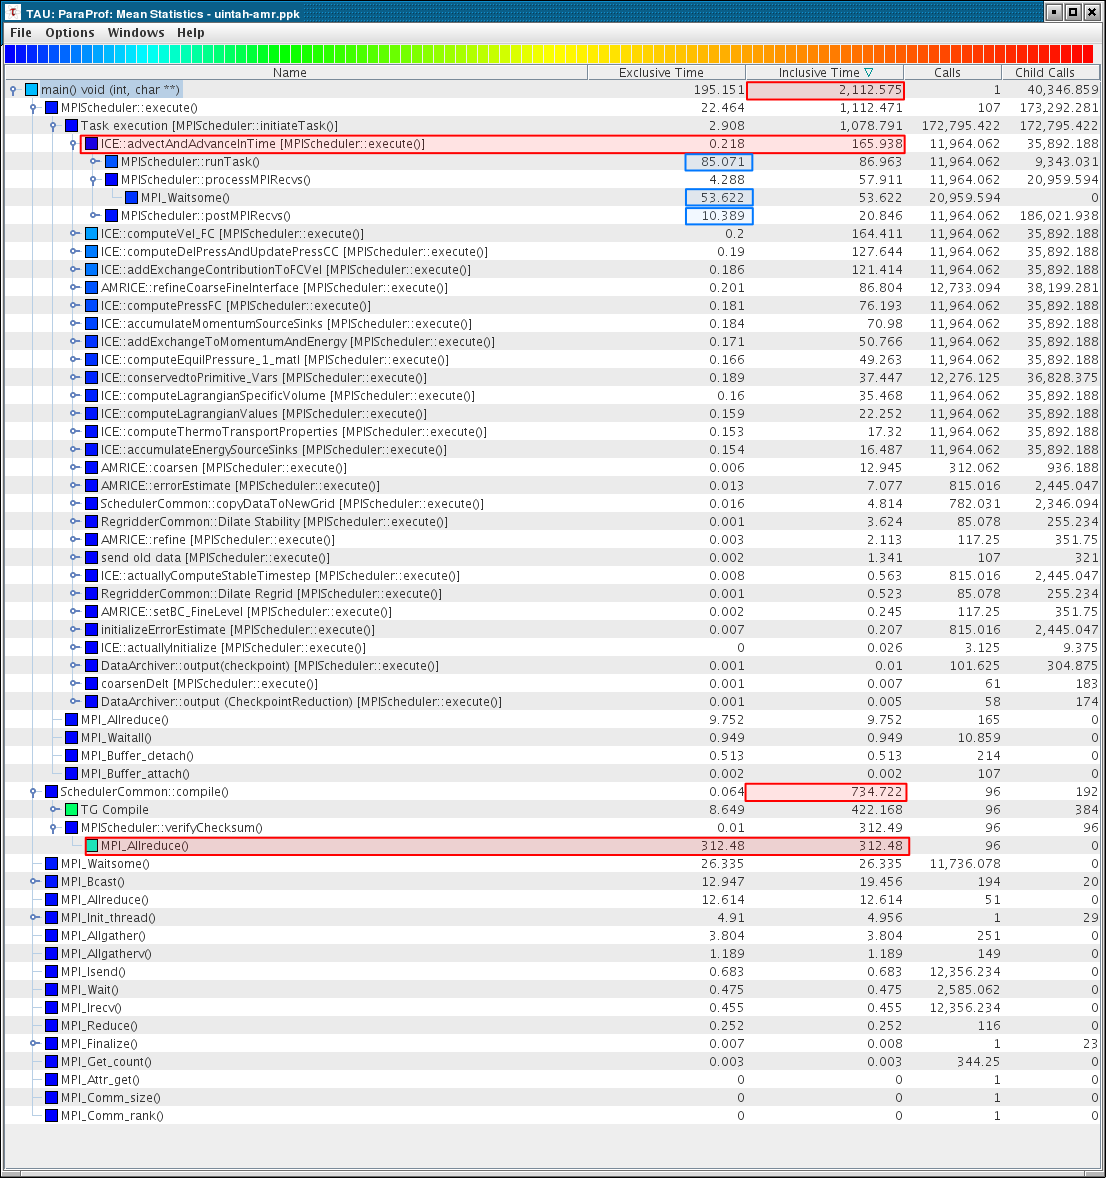
Highlighted below in the mean profile callpath view are several key numbers. First the 2112.575 second overall runtime. Next, we see that task taking the longest time is ICE::advectAndAdvanceInTime, taking 165.938.
Of that 165.938 seconds, 85.071 are spent in computation (runTask()), and 53.622 seconds are spent in MPI_Waitsome().
Also notable, 734.722 seconds (1/3rd of the execution) is spent in the SchedulerCommon::compile() step of the task graph creation/compilation phase. Of that time, 312.48 is spent in MPI_Allreduce(). The nodes perform a simple checksum to check that they all have the same graph. My guess is that the MPI_Allreduce() is simply acting as a synchronization point at the start of an iteration and that the large amount of time here is due to an imbalance in the work load (some nodes reach it much earlier than others). The range on this MPI_Allreduce(), though not shown here, ranges from 185 to 529 seconds, with a mean of 312 seconds and a standard deviation of 82 seconds.
Reverse Callpath
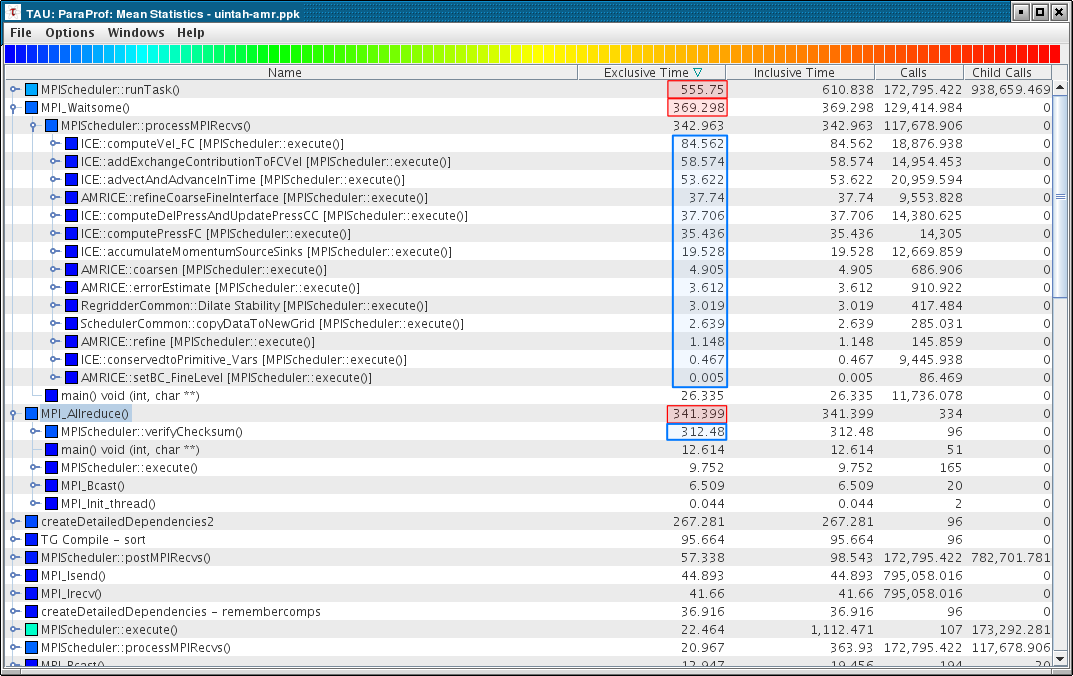
Using the reverse callpath view, we can see how the time in MPI_Waitsome() is partitioned among tasks:
Partition based on AMR level
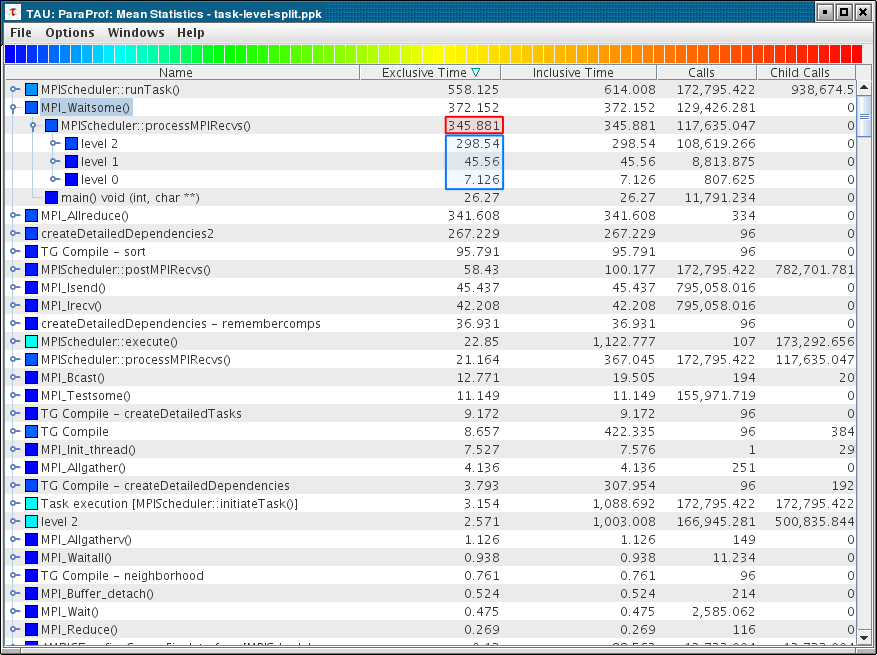
Using a mapping based on the AMR level of the patches entering the MPIScheduler::initiateTask routine, we can partition the time spent in each task based on the AMR level. From the data, it appears that only some tasks have work on multiple patches and/or multiple levels for a given node. The following data is for Node 0.
Level 0 is found on nodes 1,2,3,4,5,6,7,8 and 48,50,52,54,56,58,60,62. Most tasks (all the ones taking significant amounts of time) appear to run on a single patch and only on levels 1 and 2.
Partition based on AMR level (reversed)
Using the reverse callpath, we can see how time spent in MPI_Waitsome() is partitioned based on the level of the patch the task was processing. Units are seconds.
If we expand the level 2 node in the tree, we can see see how this time is distributed among the tasks:
Tracing
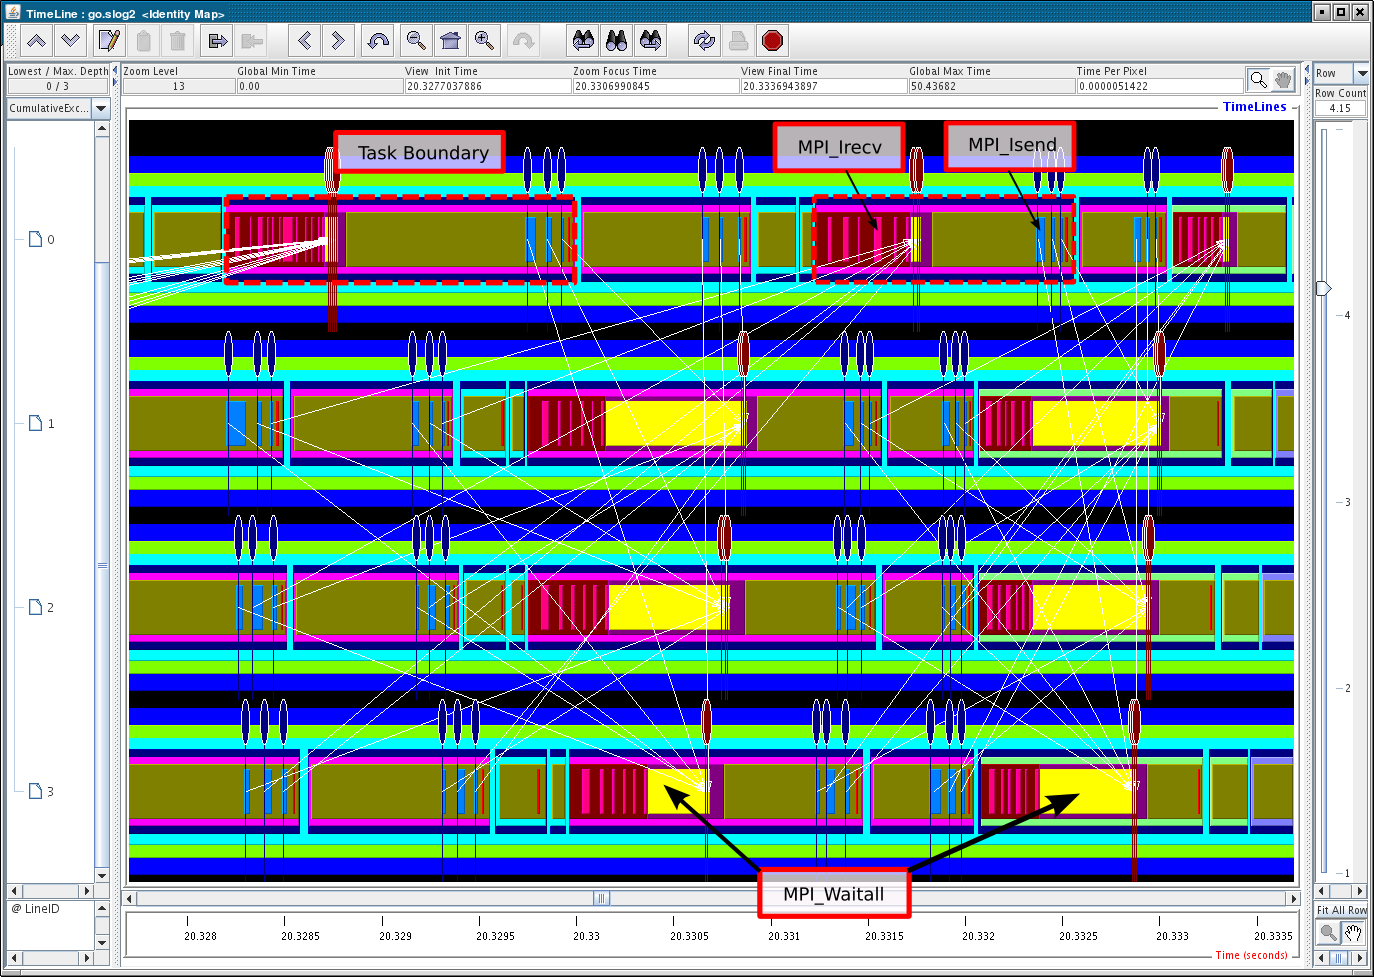
To aid in our understanding of the behaviour and interaction of various tasks, we traced a smaller input (based on the above) with only four processors. In addition, MPI_Waitsome() was changed to MPI_Waitall() to simplify the execution.
Following is a screen grab from Jumpshot, showing a small part of a trace. We can see that each task first posts MPI_Irecv's based on its 'requires', then the task waits for the data. After it recieves the data, it runs (MPIScheduler::runtTask), during which, near the end, MPI_Isends are posted to send data to other nodes for tasks that will require this data.


