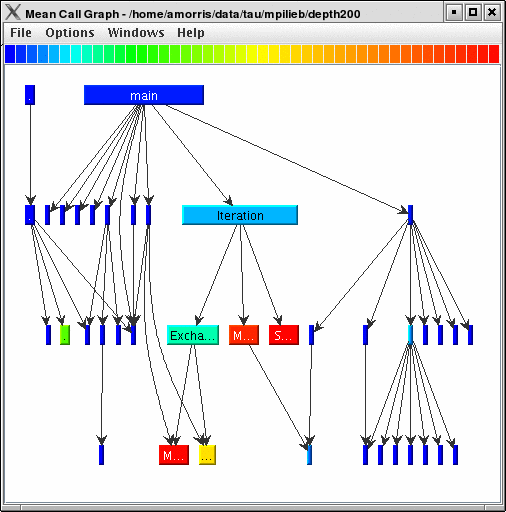
This display shows callpath data in a graph using two metrics, one determines the width, the other the color. The full name of the function as well as the two values (color and width) are displayed in a tooltip when hovering over a box. By clicking on a box, the actual ancestors and descendants for that function and their paths (arrows) will be highlighted with blue. This allows you to see which functions are called by which other functions since the interplay of multiple paths may obscure it.
