A rudimentary bar chart class : Chart « Advanced Graphics « Java
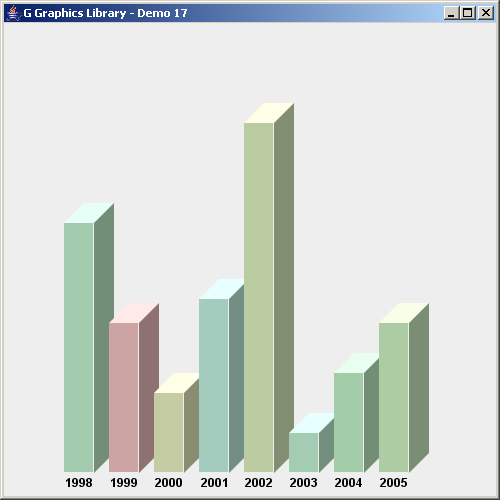
A rudimentary bar chart class
import java.awt.*;
import java.util.*;

import javax.swing.*;

import no.geosoft.cc.geometry.Geometry;
import no.geosoft.cc.graphics.*;


/**
 * G demo program. Demonstrates:
 *
 * <ul>
 * <li>A rudimentory bar chart class
 * <li>Rendering techniques
 * </ul>
 *
 * @author <a href="mailto:jacob.dreyer@geosoft.no">Jacob Dreyer</a>
 */
public class Demo17 extends JFrame
{
  public Demo17()
  {
    super ("G Graphics Library - Demo 17");
    setDefaultCloseOperation (JFrame.EXIT_ON_CLOSE);

    // Create the graphic canvas
    GWindow window = new GWindow();
    getContentPane().add (window.getCanvas());

    // Create scane with default viewport and world extent settings
    GScene scene = new GScene (window);

    GStyle chartStyle = new GStyle();
    chartStyle.setLineStyle (GStyle.LINESTYLE_INVISIBLE);
    chartStyle.setFont (new Font ("Dialog", Font.BOLD, 12));
    chartStyle.setForegroundColor (new Color (0, 0, 0));

    BarChart barChart = new BarChart (50, 450, 400, 400);
    barChart.setStyle (chartStyle);

    barChart.addBar ("1998", 250, getColor());
    barChart.addBar ("1999", 150, getColor());
    barChart.addBar ("2000",  80, getColor());
    barChart.addBar ("2001", 174, getColor());
    barChart.addBar ("2002", 350, getColor());
    barChart.addBar ("2003",  40, getColor());
    barChart.addBar ("2004", 100, getColor());
    barChart.addBar ("2005", 150, getColor());

    scene.add (barChart);

    pack();
    setSize (new Dimension (500, 500));
    setVisible (true);
  }


  private Color getColor()
  {
    return new Color (Color.HSBtoRGB ((float)Math.random(), 0.2f, 0.8f));
  }


  private class BarChart extends GObject
  {
    private int         x_, y_, width_, height_;
    private Collection  bars_;


    BarChart (int x, int y, int width, int height)
    {
      x_      = x;
      y_      = y;
      width_  = width;
      height_ = height;

      bars_ = new ArrayList();
    }


    void addBar (String label, int value, Color color)
    {
      bars_.add (new Bar (label, value, color));
    }


    public void draw()
    {
      final int BAR_WIDTH = 30;
      final int SPACING   = 15;
      final int DEPTH     = 20;

      removeSegments();

      int x0 = x_ + 10;

      double angle0 = 0.0;
      for (Iterator i = bars_.iterator(); i.hasNext(); ) {
        Bar bar = (Bar) i.next();

        int y0 = y_ - bar.value;

        GSegment main = new GSegment();
        addSegment (main);
        GStyle style = new GStyle();
        style.setForegroundColor (bar.color);
        style.setBackgroundColor (bar.color);
        main.setStyle (style);
        main.setGeometry (Geometry.createRectangle (x0, y0,
                                                    BAR_WIDTH, bar.value));

        GSegment label = new GSegment();
        addSegment (label);
        label.setGeometry (x0 + BAR_WIDTH / 2, y_ + 10);
        GText text = new GText (bar.label);
        label.setText (text);

        GSegment top = new GSegment();
        addSegment (top);
        style = new GStyle();
        style.setForegroundColor (bar.color.brighter());
        style.setBackgroundColor (bar.color.brighter());
        top.setStyle (style);
        int topXy[] = {x0, y0,
                       x0 + BAR_WIDTH, y0,
                       x0 + BAR_WIDTH + DEPTH, y0 - DEPTH,
                       x0 + DEPTH, y0 - DEPTH,
                       x0, y0};
        top.setGeometry (topXy);

        GSegment side = new GSegment();
        addSegment (side);
        style = new GStyle();
        style.setForegroundColor (bar.color.darker());
        style.setBackgroundColor (bar.color.darker());
        side.setStyle (style);
        int[] sideXy = {x0 + BAR_WIDTH, y0,
                        x0 + BAR_WIDTH + DEPTH, y0 - DEPTH,
                        x0 + BAR_WIDTH + DEPTH, y_ - DEPTH,
                        x0 + BAR_WIDTH, y_,
                        x0 + BAR_WIDTH, y0};
        side.setGeometry (sideXy);

        x0 += BAR_WIDTH + SPACING;
      }
    }
  }


  private class Bar
  {
    public String  label;
    public int     value;
    public Color   color;

    public Bar (String label, int value, Color color)
    {
      this.label = label;
      this.value = value;
      this.color = color;
    }
  }


  public static void main (String[] args)
  {
    new Demo17();
  }
}
Related examples in the same category
| 1. | Chart based on Graph library | ||
| 2. | Scroll Chart | ||
| 3. | Animation Line Chart | ||
| 4. | Pie Chart | ||
| 5. | A rudimentary chart library | ||
| 6. | bar-graph drawable |