End-to-end SAP Observability with Elastic, Google Cloud, and Kyndryl: A deep dive


Share on Twitter


Share on LinkedIn


Share on Facebook


Share by email


Print
Tens of thousands of companies in the world, across almost all industries, from midsize to large enterprises, rely on robust, efficient complex SAP systems to power their core operations. From sales to finance, from warehouse management to production planning and execution, business’s continuity, revenue, and customer success highly depend on processes running on enterprise resource planning (ERP) architectures. However, maintaining optimal SAP performance, ensuring data security, and identifying potential issues can be a complex challenge. Traditional monitoring solutions often fall short, providing siloed data views and limited insights.
At Elastic, thanks to a collaboration with Kyndryl and Google Cloud, we designed a full-stack observability experience for your SAP environment. This powerful solution combines the best of each industry leader, empowering you to unlock the full potential of your SAP data and make informed, data-driven decisions.
A comprehensive view of your SAP ecosystem: From infrastructure to business analytics

Complex SAP landscapes are composed of several ERP products (ECC, S/4HANA), analytics solutions (BW,BW/4HANA, SAC), security and compliance tools (GRC), and innovation platforms (SAP BTP, Fiori Launchpad), and they are all strictly interconnected with dozens of external systems and grounded on hybrid hosting and networking infrastructures. As a result, monitoring these landscapes often requires multiple diverse tools.
The approach Elastic proposes, together with Kyndryl and Google Cloud, goes beyond traditional monitoring, granting you a comprehensive view of your SAP ecosystem through Kibana, from bare metal to business processes, across four distinct layers:
1. Cloud and hybrid infrastructure
Gain deep insights into the health and performance of your cloud or hybrid hosting environment, and identify potential bottlenecks and resource constraints to ensure a solid foundation for your SAP applications.
The Elastic and Google Cloud ecosystem offers a wide range of options for transferring data from monitored services to security tools, tailored to specific needs and architectures. Elastic provides native integrations with Google Cloud and third-party services for ingesting, processing, searching, and visualizing logs, metrics, and traces. Central to this capability is the Elastic Agent, which streamlines data collection and parsing and offers pre-built dashboards in Kibana within a single tool. In addition to its role as an observability cornerstone, it’s also effective as an endpoint protection tool, using machine learning algorithms and behavioral analytics for real-time malware detection, vulnerability scanning, and enforcement of security policies. The centralized management UI, Fleet, accessible through Kibana, allows effortless oversight of distributed fleets, simplifying tasks like updates, policy changes, and configurations.
The Elastic Agent supports logs streams from various Google Cloud services, including Google Cloud Storage, VMs, Kubernetes, VPC, firewalls, DNS, functions, and Pub/Sub. Notably, Pub/Sub acts as a proxy for seamless data publication from different Google services. Through the Pub/Sub log sink, users can access Google's entire ecosystem, even in cases where direct integrations aren't available. These features enhance data collection capabilities, enabling organizations to efficiently monitor and secure their Google Cloud environments while simplifying management tasks from a centralized interface.
As an example: A critical business activity is blocked due to unknown failure in the system chain — is it depending on disrupted VPN, a hostname resolution error due to DNS failure, or a bandwidth limit compromising SAP and other systems communicating? SAP systems admins and SREs are able to easily analyze any disruption, finding source causes, correlating events, and identifying anomaly patterns with AI-driven tools.

2. SAP workloads: Machine layer
The same Elastic Agent capabilities are applicable to the VMs hosting your SAP workloads, leveraging generic OS and Compute Engine specific integrations the agent is equipped with. Through the agent you’ll be able to leverage both performance monitoring use cases and security logs collection and analysis, as well as active endpoint threat protection using a single component. In addition to that, specifically for SAP workloads, the Google Cloud’s Agent for SAP comes into play.
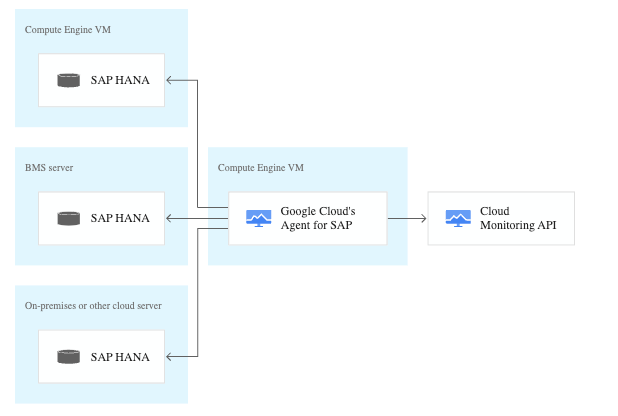
Google Cloud's Agent for SAP is a versatile tool designed to enhance monitoring and management of SAP workloads running on Compute Engine and bare metal instances, whether on Linux or Windows operating systems. Acting as the successor to the Monitoring Agent for Netweaver 2.0, it amalgamates several previous monitoring agents while introducing new capabilities and features. The agent diligently collects crucial information about SAP workloads, both HANA and non-HANA based.
One of the core functionalities of the Agent for SAP is its capability to collect SAP Host Agent Metrics, which are vital for SAP's understanding of the host machine and its environment. These metrics encompass CPU utilization, memory consumption, disk throughput, latency, network bandwidth, and configuration details. Moreover, the agent facilitates Process Monitoring Metrics, providing insights into SAP application states and runtime conditions, along with Workload Manager Validation Metrics for adherence to best practices.
The Agent for SAP operates seamlessly, sending collected metrics to both SAP Host Agent and Google Cloud Monitoring. Its configuration flexibility ensures that customers have full control over what data is collected: you can explore metrics that the agent collects via the SAP Note 2469354 - Key Monitoring Metrics for SAP on IaaS Infrastructure. Transparency is prioritized through open-sourced code on GitHub while it has minimal performance and cost impact on your machines and applications.
These two agents — you can install both or just your favorite one — are essential for maintaining optimal performance and reliability and both will be able to forward collected data to Elasticsearch for advanced AI-driven search insights and data visualization through Kibana, your unified access point to your data. Discover how to integrate Google’s Cloud Logging and Cloud Monitoring with Elastic.
3. SAP workloads: Application layer
Kyndryl provides comprehensive IT infrastructure services, including cloud services, networking, data management, security, and digital transformation solutions, designed to help enterprises optimize and modernize their IT operations, improve agility, and drive business growth.
With several years of expertise in SAP systems, Kyndryl has built a custom connector to ingest SAP application data into Elastic. It enables the generation of insights from the third layer of the pyramid above, focusing on application health and user experience.
Additionally, visualizations, dashboards, and machine learning jobs transform raw data into actionable intelligence.
Data of interest at this layer includes:
User activities within the SAP application (logins, transactions, searches)
Audit logs tracking system changes and user actions
Background job performance and completion times
SAP process execution metrics (response times, memory usage)
At this layer, you can deep dive into user activities, audit logs, background transactions, and ABAP programs. Leveraging our visualizations and alerts allows you to diagnose issues, identify performance bottlenecks, and ensure optimal application functionality.
Architectural overview
In order to monitor your SAP application environment, several components are necessary. The SAP infrastructure will comprehend the SAP instances and a Linux or Windows server where we will install a Filbeat agent. On the other hand, the Elasticsearch infrastructure, in the cloud or on-premise, will receive the data extracted from the SAP applications.

A Java application developed by Kyndryl will be installed on the SAP JVMs. This application will connect to the SAP instance and establish a connection to the SAP primary application server using SAP Java connector. It will execute an SAP function module to retrieve SAP performance metrics and create a CSV file. The CSV file is then detected by the Filebeat agent which will, in turn, send each line of the content of the file to an Elasticsearch ingest pipeline. At this stage, each received line will be parsed and indexed in Elasticsearch, ready to be queried and used.
In alternative to this method, it is possible to use a direct connection from the Java application to Elasticsearch, sending SAP performance metrics directly using the Elasticsearch Java API.
Both ECC and S/4HANA can be monitored through the Java application above.
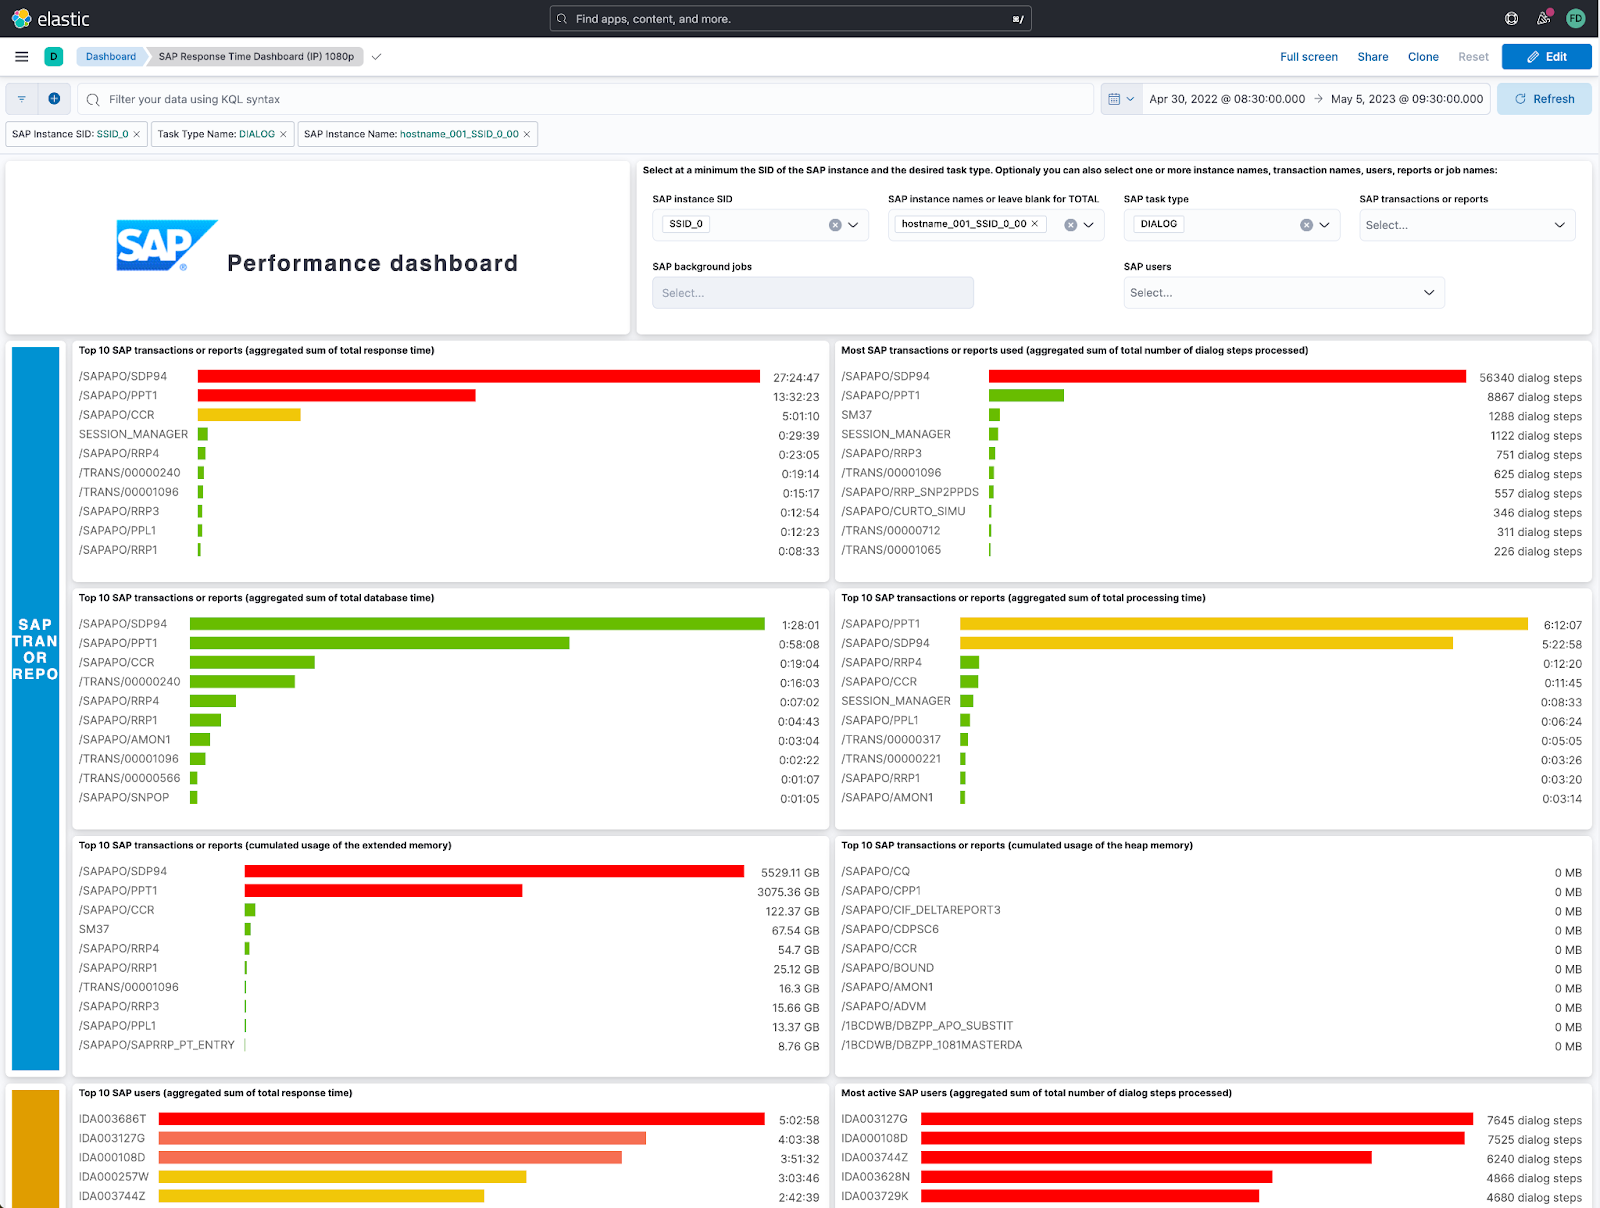
Once the data has been indexed and stored in Elastic, it is ready to be consumed. Ad-hoc dashboards, visualizations, and alerts, developed by Kyndryl, are provided in Kibana. A few examples are below.

Example of an investigation
Let’s make an example of how this integration would help understand the root cause of possible issues and solve them promptly.
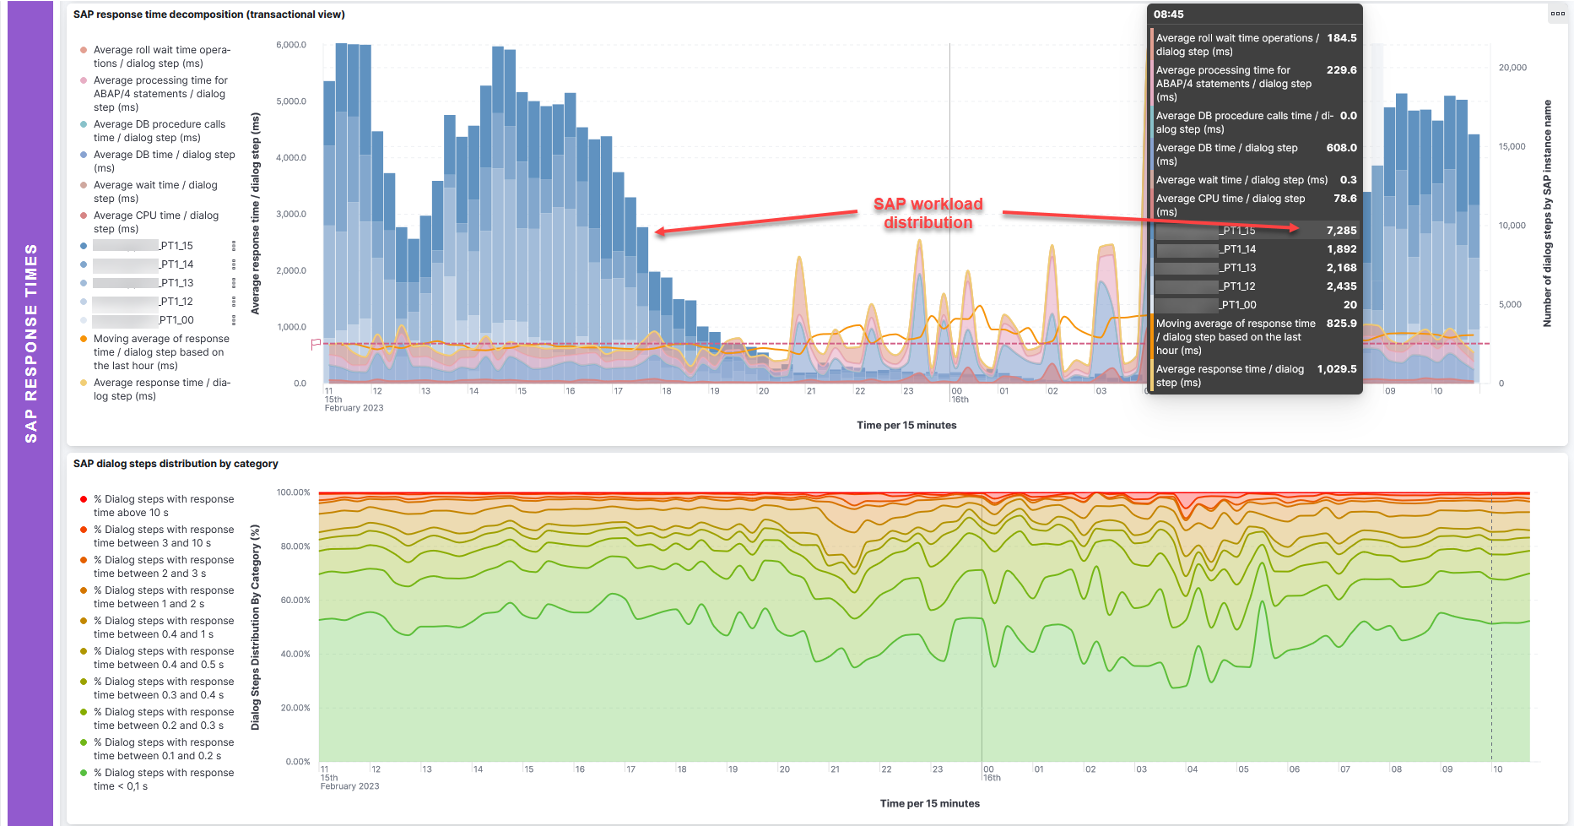
Looking at the SAP Response Times dashboard, we can see that that at around 8:30 a.m. there is an anomalous response time of around 5s:

This issue manifests between 4:30 a.m. and 9:30 a.m. The response time distribution chart shows that on average only 50% of the total dialog steps processed by the SAP instances have an average response time around 1 second during the same period of time.
Looking closely at the decomposition of the response time, we can observe that the main cause of the high response time is the roll wait time (above 3.5 seconds). A high roll wait time is usually an indicator of a network issue that must be investigated. It is then possible to continue the investigation leveraging Elastic’s broader observability solution to identify the network issue and address it quickly.
4. Business analytics
Most valuable SAP data resides in business processes it manages. A comprehensive approach to SAP observability can’t avoid taking into consideration the huge amount of data produced by activities ongoing in Sales, Finance, Logistics, Production, etc. This empowers data-driven decision making by uncovering hidden patterns and opportunities for improvement. Examples include:
Business analytics for identified modules
Advanced geo-spatial search (e.g., transportation management, retail sales)
Identifying correlations between application performance issues and fluctuations in production schedule, delivery time, and sales figures
Analyzing how changes in processes impact system resource utilization
Enabling fraud-detection alerting systems
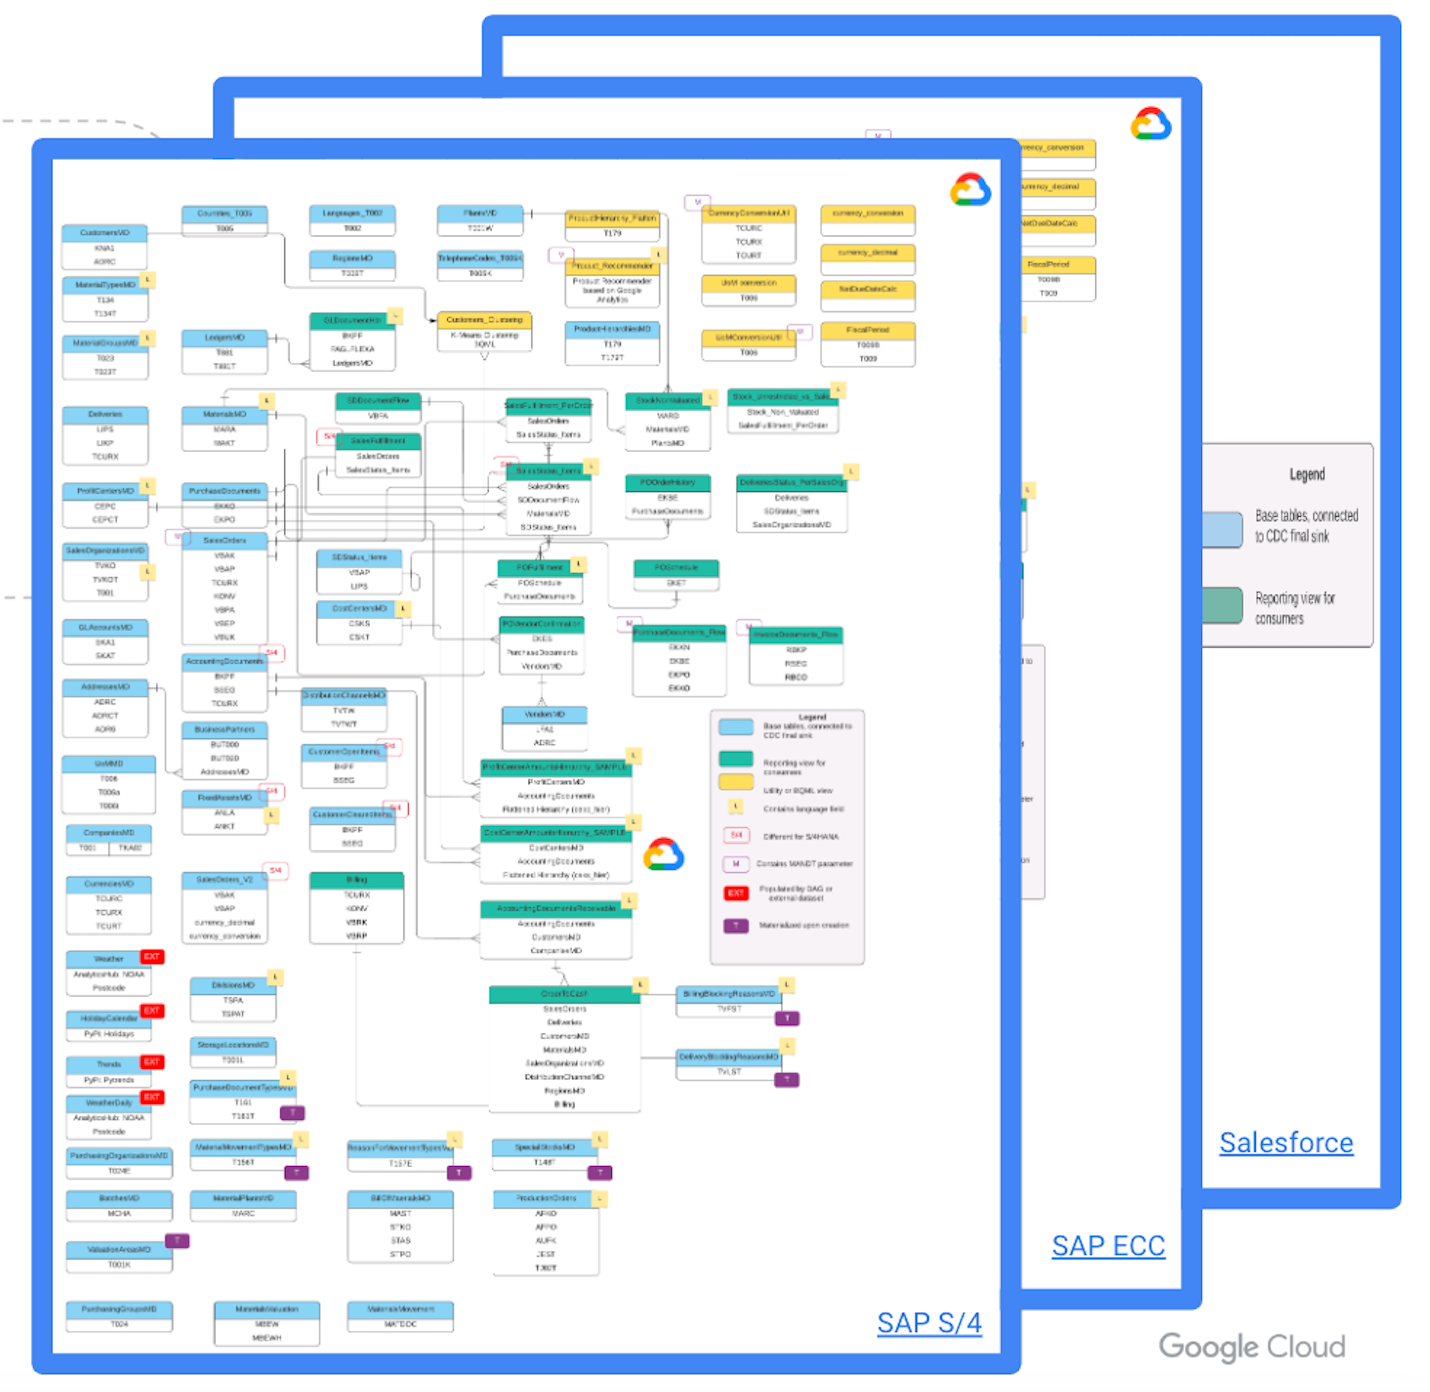
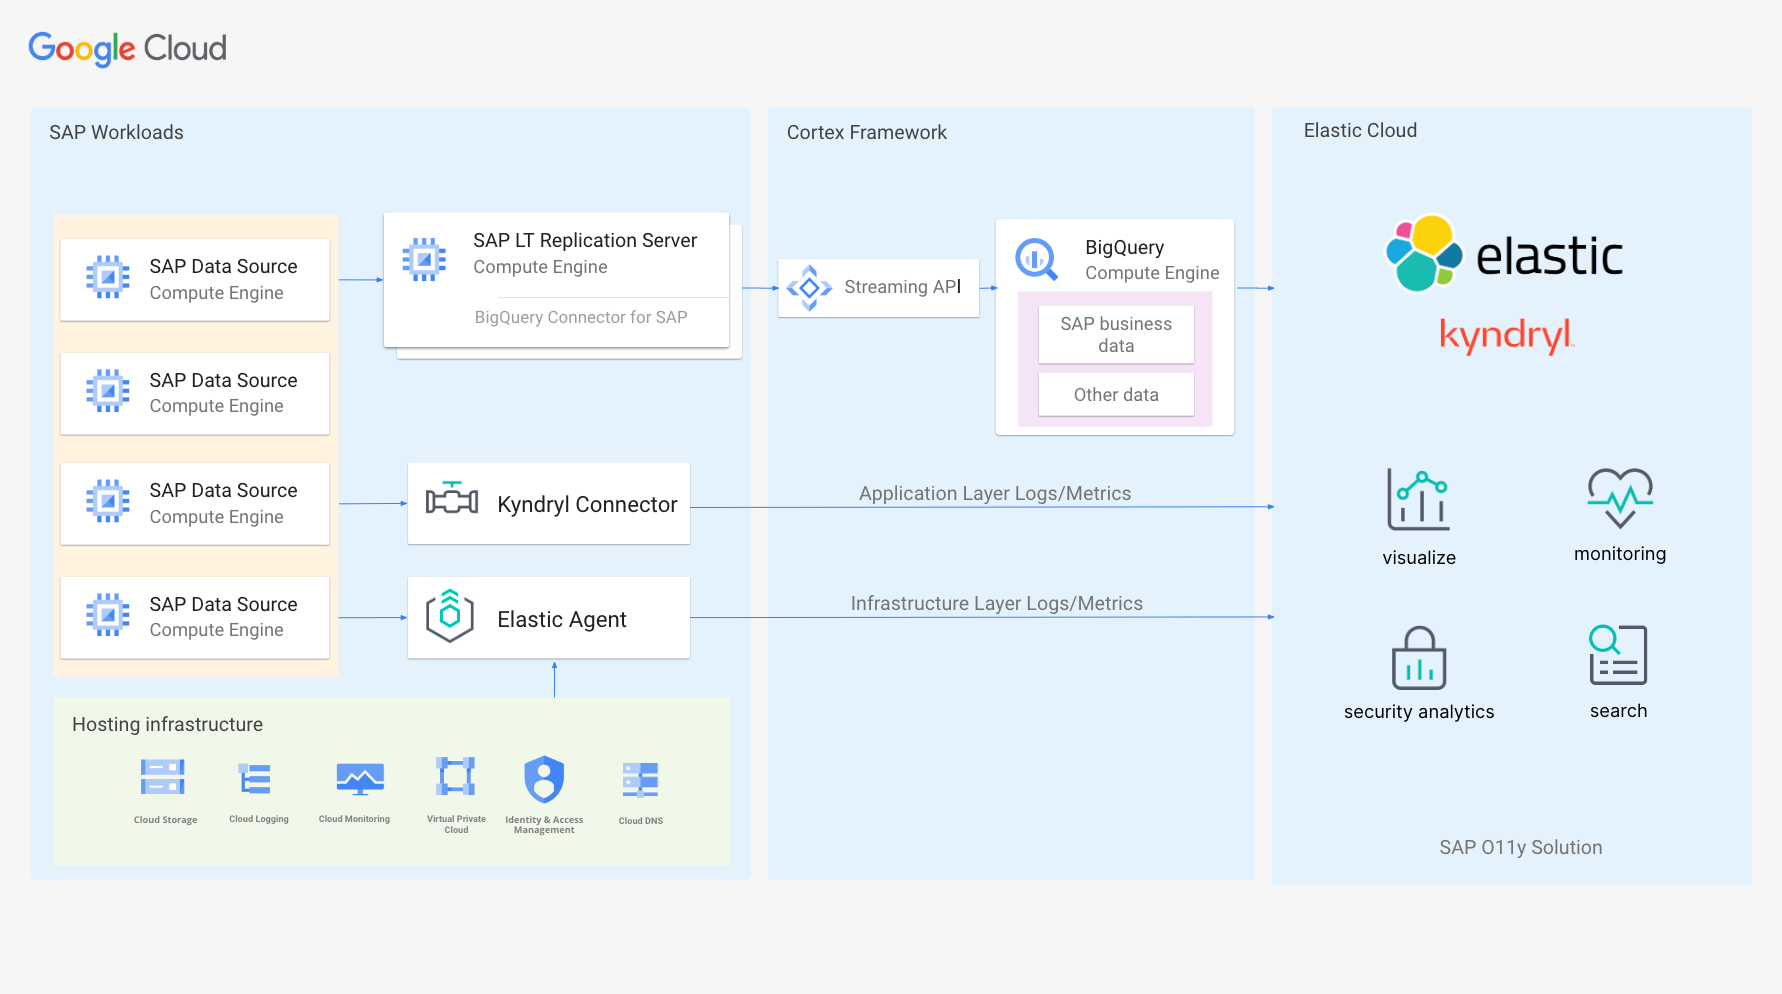
The Google Cloud Cortex Framework is a package of expertise that facilitates the utilization of SAP and other applications' data to drive innovation in analytics and business processes on the Google Cloud. It offers a collection of services aimed at building, deploying, and managing advanced analytics solutions, streamlining implementation to allow quick experimentation without extensive setup time. By following straightforward instructions, customers can deploy required Google Cloud services within minutes. This framework simplifies integration with pre-built connectors for common applications and systems, enabling real-time insights and reducing the risk, complexity, and cost of implementations.
One key integration supported by the Google Cortex Framework with SAP is via the Landscape Transformation Replication Server (LT Replication Server). The Cortex framework enables the integration of SAP data directly into Google BigQuery, Google Cloud's fully managed enterprise data warehouse. By leveraging the BigQuery connector for SAP, installed within the LT Replication Server, businesses can achieve near real-time replication of SAP data into BigQuery.
Google BigQuery, with its serverless architecture and scalable, distributed analysis engine, provides a robust platform to run queries on large-volume SAP application data, while also integrating it with other sources (e.g., Salesforce), enabling comprehensive analytics across the whole organization's data landscape. It also comes with a pre-built data model for SAP, which helps users accurately map data in their data warehouse the way they are used to in their ERP system.
As your data foundation is built into BigQuery, you are ready to leverage Kibana as your search and data visualization speed layer on top of it, where the correlation magic between the previously collected infrastructure logs and the business data will happen. Selected BigQuery data can be easily moved to Elasticsearch via the dedicated Dataflow template.
For different data warehousing strategy or architecture, is it also possible to stream SAP business data directly from your ERP system to an Elasticsearch index via your favorite ETL or message broker — for instance, Confluent Kafka connector.
Unlocking the true potential of your SAP environment
We have seen how important it is to be able to monitor all layers of your enterprise environment to understand all aspects of your business and remediate issues fast, if necessary.
Building a solution that can comprehensively monitor SAP environments is not trivial. The partnership between Elastic, Google Cloud, and Kyndryl has proven to overcome this complexity and has allowed us to build a single solution that monitors SAP from 360°. We monitor the infrastructure, the machine, the application, and the business analytics layer. This allows us to correlate infrastructure issues with business objectives or application issues with the infrastructure architecture, and so on.
This means that you will be able to take into account all aspects that could contribute to an issue and find the root cause quickly. Moreover, it enables you to spot performance degradation before it causes an outage and severely impacts your processes, keeping your organization focused on your main business.
To leverage the full potential of our integrated observability solution, we encourage you to start with a free 14-day trial cluster on Elastic Cloud using your Google Cloud account, or easily subscribe to Elastic Cloud through Google Cloud Marketplace. This is your first step to test the endless possibilities of monitoring your SAP workloads.
The release and timing of any features or functionality described in this post remain at Elastic's sole discretion. Any features or functionality not currently available may not be delivered on time or at all.
Share
Share on Twitter
Share on LinkedIn
Share on Facebook
Share by email
Print

